Homerville, Georgia facts for kids
Quick facts for kids
Homerville, Georgia
|
||
|---|---|---|

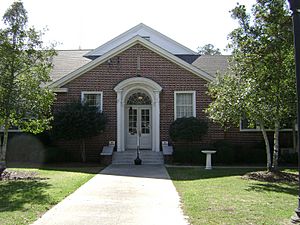
Homerville City Hall in 2012
|
||
|
||

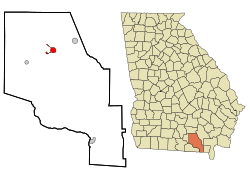
Location in Clinch County and the state of Georgia
|
||
| Country | United States | |
| State | Georgia | |
| County | Clinch | |
| Area | ||
| • Total | 3.51 sq mi (9.09 km2) | |
| • Land | 3.49 sq mi (9.05 km2) | |
| • Water | 0.02 sq mi (0.04 km2) | |
| Elevation | 177 ft (54 m) | |
| Population
(2020)
|
||
| • Total | 2,344 | |
| • Density | 671.06/sq mi (259.10/km2) | |
| Time zone | UTC-5 (Eastern (EST)) | |
| • Summer (DST) | UTC-4 (EDT) | |
| ZIP code |
31634
|
|
| Area code(s) | 912 | |
| FIPS code | 13-39748 | |
| GNIS feature ID | 0356319 | |
Homerville is a city in Georgia, United States. It is the main town, also known as the county seat, for Clinch County. In 2010, about 2,456 people lived there. The city officially became a town on February 15, 1869.
Contents
History of Homerville
How Clinch County Was Formed
Clinch County was created on February 14, 1850. This happened because the Georgia General Assembly passed a law. The county was named after General Duncan Lamont Clinch. He was a respected United States general and a congressman from Georgia. Clinch County was the 95th county in Georgia. It was made from land that used to belong to the Oconee people. Parts of Ware County and Lowndes County were also used to form it.
Choosing a County Seat
When the county was formed, a group of five commissioners was chosen. Their job was to pick a place for the county seat. The county seat is the main town where the government offices are. They quickly chose a spot near where Homerville is today. They decided to name this new county seat "Polk" after President James K. Polk.
However, two years later, the Georgia General Assembly changed the name. They renamed the county seat to "Magnolia". This happened just as the county's first courthouse was finished. This first courthouse was quite small. It was destroyed in 1856 by fire. Someone who was unhappy with a legal decision likely burned it down.
The Start of Homerville
In February 1853, Dr. John Homer Mattox and his family moved to the area. They settled on land next to the Magnolia stagecoach route. He named his new settlement Homersville after his family. Soon after, the Atlantic and Gulf Railroad expanded. The train tracks replaced the old stagecoach route. Mattox's settlement then became known simply as "Station No. 11".
Over time, the settlement grew bigger. By 1860, about 275 people in Clinch County asked the Georgia General Assembly to move the county seat. They wanted it moved from Magnolia to Mattox's settlement. Later that same year, the lawmakers agreed. They officially named Station No. 11 the county seat of Clinch County. By 1863, the town of Homersville was called Forest. It took about nine more years for the state to officially recognize the name Homerville. The city was officially incorporated in 1869. However, newspapers were already calling the county seat Homerville by March 1864.
Dr. Mattox's Original Home
Dr. John Homer Mattox's first house is still standing today. It is now the home of the Clinch County Chamber of Commerce and Welcome Center. The house was recently fixed up. Many rooms were restored to how they looked long ago. Modern things like plumbing and air conditioning were also added. The building now holds the offices for the Chamber of Commerce. It also has a museum about the early days of Clinch County.
Geography and Location
Where is Homerville?
Homerville is located in the northern part of Clinch County. Its exact location is 31°2′13″N 82°45′5″W / 31.03694°N 82.75139°W. Two major roads, U.S. Routes 84 and 441, meet in the middle of town.
- US 84 goes east 27 miles (43 km) to Waycross. It goes west 35 miles (56 km) to Valdosta.
- US 441 goes north 35 miles (56 km) to Douglas, Georgia. It goes south 67 miles (108 km) to Lake City, Florida.
Land and Water
The United States Census Bureau says that Homerville covers a total area of 3.51 square miles (9.1 km2). Only a very small part of this, about 0.02 square miles (0.04 km2), is water. The city is surrounded by wooded areas and swampy marshes.
| Climate data for Homerville, Georgia | |||||||||||||
|---|---|---|---|---|---|---|---|---|---|---|---|---|---|
| Month | Jan | Feb | Mar | Apr | May | Jun | Jul | Aug | Sep | Oct | Nov | Dec | Year |
| Record high °F (°C) | 82 (28) |
84 (29) |
88 (31) |
91 (33) |
99 (37) |
104 (40) |
101 (38) |
100 (38) |
98 (37) |
94 (34) |
85 (29) |
80 (27) |
104 (40) |
| Mean daily maximum °F (°C) | 61.4 (16.3) |
65.4 (18.6) |
71.8 (22.1) |
78.8 (26.0) |
85.8 (29.9) |
90.4 (32.4) |
92.3 (33.5) |
91 (33) |
86.9 (30.5) |
79.2 (26.2) |
71.2 (21.8) |
63.3 (17.4) |
92.3 (33.5) |
| Daily mean °F (°C) | 48.8 (9.3) |
52.3 (11.3) |
58.2 (14.6) |
64.5 (18.1) |
72 (22) |
78.2 (25.7) |
80.6 (27.0) |
80 (27) |
76 (24) |
66.8 (19.3) |
58.1 (14.5) |
50.7 (10.4) |
65.6 (18.7) |
| Mean daily minimum °F (°C) | 36.2 (2.3) |
39.2 (4.0) |
44.7 (7.1) |
50.3 (10.2) |
58.2 (14.6) |
66.1 (18.9) |
68.8 (20.4) |
69 (21) |
65.1 (18.4) |
54.4 (12.4) |
45.1 (7.3) |
38.2 (3.4) |
36.2 (2.3) |
| Record low °F (°C) | 21 (−6) |
18 (−8) |
25 (−4) |
39 (4) |
47 (8) |
55 (13) |
66 (19) |
64 (18) |
56 (13) |
34 (1) |
23 (−5) |
22 (−6) |
18 (−8) |
| Average precipitation inches (mm) | 4.7 (120) |
4 (100) |
4.6 (120) |
2.9 (74) |
2.6 (66) |
6 (150) |
6.3 (160) |
6.1 (150) |
4.4 (110) |
2.9 (74) |
2.7 (69) |
3.3 (84) |
50.3 (1,280) |
| Average snowfall inches (cm) | 0 (0) |
0 (0) |
0 (0) |
0 (0) |
0 (0) |
0 (0) |
0 (0) |
0 (0) |
0 (0) |
0 (0) |
0 (0) |
0.1 (0.25) |
0.1 (0.25) |
| Average precipitation days | 9.9 | 9.1 | 8.8 | 6 | 7.1 | 12.9 | 13.9 | 12.4 | 9.5 | 6.8 | 6.8 | 8.3 | 111.5 |
| Source: Weatherbase | |||||||||||||
People in Homerville: Demographics
Population Changes Over Time
The population of Homerville has changed a lot over the years. A census is a count of all the people living in a place. It happens every ten years. You can see how the number of people has grown and shrunk in the table below.
| Historical population | |||
|---|---|---|---|
| Census | Pop. | %± | |
| 1880 | 201 | — | |
| 1900 | 434 | — | |
| 1910 | 437 | 0.7% | |
| 1920 | 627 | 43.5% | |
| 1930 | 1,150 | 83.4% | |
| 1940 | 1,522 | 32.3% | |
| 1950 | 1,787 | 17.4% | |
| 1960 | 2,634 | 47.4% | |
| 1970 | 3,025 | 14.8% | |
| 1980 | 3,112 | 2.9% | |
| 1990 | 2,560 | −17.7% | |
| 2000 | 2,803 | 9.5% | |
| 2010 | 2,456 | −12.4% | |
| 2020 | 2,344 | −4.6% | |
| U.S. Decennial Census 1850-1870 1870-1880 1890-1910 1920-1930 1940 1950 1960 1970 1980 1990 2000 2010 |
|||
Who Lives in Homerville?
The table below shows the different groups of people living in Homerville as of the 2020 census. This helps us understand the mix of cultures and backgrounds in the city.
| Race | Num. | Perc. |
|---|---|---|
| White (non-Hispanic) | 1,067 | 45.52% |
| Black or African American (non-Hispanic) | 1,086 | 46.33% |
| Native American | 11 | 0.47% |
| Asian | 17 | 0.73% |
| Pacific Islander | 4 | 0.17% |
| Other/Mixed | 81 | 3.46% |
| Hispanic or Latino | 78 | 3.33% |
In 2020, the United States census counted 2,344 people living in Homerville. These people lived in 983 households, and 610 of these were families.
Education in Homerville
Clinch County School District
The Clinch County School District is in charge of public schools in the area. It provides education for students from pre-school all the way to twelfth grade. The district includes:
- A Headstart program for very young children.
- An elementary/middle school.
- A high school.
The school district has 96 full-time teachers. They teach over 1,499 students in total.
- Clinch County Elementary School
- Clinch County Middle School
- Clinch County High School
See also
 In Spanish: Homerville para niños


