Lindsay, California facts for kids
Quick facts for kids
Lindsay, California
|
|
|---|---|

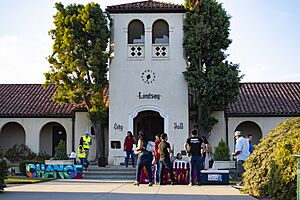
Lindsay City Hall
|
|
| Motto(s):
Central California's Citrus Center
|
|

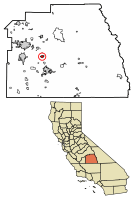
Location of Lindsay in Tulare County, California.
|
|
| Country | United States |
| State | California |
| County | Tulare |
| Incorporated | February 28, 1910 |
| Government | |
| • Type | Mayor |
| Area | |
| • Total | 2.72 sq mi (7.05 km2) |
| • Land | 2.72 sq mi (7.05 km2) |
| • Water | 0.00 sq mi (0.00 km2) 0% |
| Elevation | 387 ft (118 m) |
| Population
(2020)
|
|
| • Total | 12,659 |
| • Density | 4,944.18/sq mi (1,908.64/km2) |
| Time zone | UTC-8 (Pacific (PST)) |
| • Summer (DST) | UTC-7 (PDT) |
| ZIP code |
93247
|
| Area code(s) | 559 |
| FIPS code | 06-41712 |
| GNIS feature ID | 1652744 |
Lindsay is a city in Tulare County, California, United States. In 2020, about 12,659 people lived there. Lindsay is located southeast of Visalia and north of Porterville. It is part of the larger Visalia-Porterville Metropolitan Area.
Contents
History of Lindsay
For many centuries, the Yandanchei tribe of Native Americans used to hunt and fish in the area where Lindsay is now.
In 1889, Captain Arthur Hutchinson moved to California because he was not well. He bought 2,000 acres (about 8 square kilometers) of land in the Lindsay area. He then started the Lindsay Land Company.
When the Southern Pacific Railroad built tracks through the area in 1889, Captain Hutchinson began to plan the town. He named the community after his wife, Sadie Lindsay Patton Hutchinson. The city was officially formed on February 28, 1910.
Geography and Climate
Lindsay covers a total area of about 2.6 square miles (6.8 square kilometers). All of this area is land.
Lindsay's Climate Patterns
Lindsay has a semi-arid climate. This means it has hot, dry summers and cool, wet winters. It doesn't get much rain overall.
| Climate data for Lindsay, California (1991–2020 normals, extremes 1913–present) | |||||||||||||
|---|---|---|---|---|---|---|---|---|---|---|---|---|---|
| Month | Jan | Feb | Mar | Apr | May | Jun | Jul | Aug | Sep | Oct | Nov | Dec | Year |
| Record high °F (°C) | 81 (27) |
87 (31) |
96 (36) |
100 (38) |
107 (42) |
114 (46) |
115 (46) |
113 (45) |
112 (44) |
102 (39) |
91 (33) |
82 (28) |
115 (46) |
| Mean maximum °F (°C) | 71.2 (21.8) |
76.1 (24.5) |
83.5 (28.6) |
91.1 (32.8) |
98.3 (36.8) |
104.2 (40.1) |
106.0 (41.1) |
105.6 (40.9) |
102.2 (39.0) |
94.0 (34.4) |
81.1 (27.3) |
70.2 (21.2) |
107.7 (42.1) |
| Mean daily maximum °F (°C) | 57.1 (13.9) |
62.7 (17.1) |
69.0 (20.6) |
74.5 (23.6) |
82.6 (28.1) |
90.6 (32.6) |
96.3 (35.7) |
95.6 (35.3) |
90.5 (32.5) |
79.2 (26.2) |
65.9 (18.8) |
57.3 (14.1) |
76.8 (24.9) |
| Daily mean °F (°C) | 47.0 (8.3) |
51.3 (10.7) |
56.2 (13.4) |
60.6 (15.9) |
67.5 (19.7) |
74.3 (23.5) |
80.4 (26.9) |
78.9 (26.1) |
73.9 (23.3) |
64.2 (17.9) |
53.6 (12.0) |
46.6 (8.1) |
62.9 (17.2) |
| Mean daily minimum °F (°C) | 37.0 (2.8) |
39.9 (4.4) |
43.5 (6.4) |
46.8 (8.2) |
52.4 (11.3) |
58.0 (14.4) |
64.4 (18.0) |
62.3 (16.8) |
57.3 (14.1) |
49.1 (9.5) |
41.2 (5.1) |
36.0 (2.2) |
49.0 (9.4) |
| Mean minimum °F (°C) | 27.7 (−2.4) |
30.1 (−1.1) |
33.9 (1.1) |
36.2 (2.3) |
41.8 (5.4) |
47.4 (8.6) |
55.8 (13.2) |
54.3 (12.4) |
47.8 (8.8) |
39.7 (4.3) |
31.1 (−0.5) |
26.9 (−2.8) |
25.9 (−3.4) |
| Record low °F (°C) | 18 (−8) |
22 (−6) |
25 (−4) |
26 (−3) |
33 (1) |
39 (4) |
46 (8) |
44 (7) |
35 (2) |
28 (−2) |
23 (−5) |
17 (−8) |
17 (−8) |
| Average precipitation inches (mm) | 2.25 (57) |
2.18 (55) |
2.00 (51) |
1.25 (32) |
0.49 (12) |
0.10 (2.5) |
0.08 (2.0) |
0.01 (0.25) |
0.07 (1.8) |
0.65 (17) |
1.11 (28) |
1.93 (49) |
12.12 (307.55) |
| Average snowfall inches (cm) | 0.2 (0.51) |
0.0 (0.0) |
0.0 (0.0) |
0.0 (0.0) |
0.0 (0.0) |
0.0 (0.0) |
0.0 (0.0) |
0.0 (0.0) |
0.0 (0.0) |
0.0 (0.0) |
0.0 (0.0) |
0.0 (0.0) |
0.2 (0.51) |
| Average precipitation days (≥ 0.01 in) | 8.6 | 7.9 | 6.5 | 4.3 | 2.6 | 0.5 | 0.1 | 0.2 | 0.5 | 2.3 | 4.4 | 7.3 | 45.2 |
| Average snowy days (≥ 0.1 in) | 0.0 | 0.0 | 0.0 | 0.0 | 0.0 | 0.0 | 0.0 | 0.0 | 0.0 | 0.0 | 0.0 | 0.0 | 0.0 |
| Source: NOAA | |||||||||||||
People and Population in Lindsay
| Historical population | |||
|---|---|---|---|
| Census | Pop. | %± | |
| 1910 | 1,814 | — | |
| 1920 | 2,576 | 42.0% | |
| 1930 | 3,878 | 50.5% | |
| 1940 | 4,397 | 13.4% | |
| 1950 | 5,060 | 15.1% | |
| 1960 | 5,397 | 6.7% | |
| 1970 | 5,206 | −3.5% | |
| 1980 | 6,936 | 33.2% | |
| 1990 | 8,338 | 20.2% | |
| 2000 | 10,297 | 23.5% | |
| 2010 | 11,768 | 14.3% | |
| 2020 | 12,659 | 7.6% | |
| U.S. Decennial Census | |||
Lindsay's Population in 2020
In 2020, Lindsay had a population of 12,659 people. Most of the people living in Lindsay, about 88.4%, were of Hispanic or Latino background.
There were 3,763 homes in Lindsay. On average, about 3.31 people lived in each home. In many homes (74.6%), a language other than English is spoken.
Most homes in Lindsay (88%) have a computer. Also, 70.2% of homes have a fast internet connection. The average income for a household was $31,489. About 29.5% of the people in Lindsay lived below the poverty line.
Economy of Lindsay
Lindsay's main business is agriculture. The city is especially known for growing citrus fruits like oranges and lemons. This is why its motto is "Central California's Citrus Center."
Arts and Culture
Lindsay offers a "Mural Tour" where visitors can see many beautiful wall paintings around the city. These murals often show the history and culture of the area.
Sister Cities
Lindsay has one sister city:
See also
 In Spanish: Lindsay (California) para niños
 | Jewel Prestage |
 | Ella Baker |
 | Fannie Lou Hamer |


