
Tulare County, California facts for kids
Quick facts for kids
Tulare County, California
|
|||
|---|---|---|---|
   .JPG) Pictures, from top to bottom, left to right: Acequia Avenue in Visalia, Allensworth Hotel in Colonel Allensworth State Historic Park, Moro Rock in Sequoia National Park, Lake Kaweah
|
|||
|
|||

Where Tulare County is in California
|
|||
| Country | United States | ||
| State | California | ||
| Regions | San Joaquin Valley and Sierra Nevada | ||
| Metro area | Visalia-Porterville Metropolitan Area | ||
| Started | July 10, 1852 | ||
| Named for | Tulare Lake, named after the tule rush plants | ||
| County seat | Visalia | ||
| Largest city | Visalia | ||
| Cities | 8 | ||
| Government | |||
| • Type | Council–CAO | ||
| • Body | Board of Supervisors | ||
| Area | |||
| • Total | 4,839 sq mi (12,530 km2) | ||
| • Land | 4,823 sq mi (12,490 km2) | ||
| • Water | 14 sq mi (40 km2) | ||
| Highest elevation | 14,501 ft (4,420 m) | ||
| Population
(2020)
|
|||
| • Total | 473,117 | ||
| • Estimate
(2023)
|
479,468 |
||
| • Density | 97.772/sq mi (37.750/km2) | ||
| GDP | |||
| • Total | $22.794 billion (2022) | ||
| Time zone | UTC−8 (Pacific) | ||
| • Summer (DST) | UTC−7 (PDT) | ||
| Area code | 559, 661 | ||
| FIPS code | 06-107 | ||
| GNIS feature ID | 277318 | ||
| Congressional districts | 20th, 21st, 22nd | ||


Tulare County is a county in California. As of 2020, about 473,117 people live there. The main city and county seat is Visalia.
The county gets its name from Tulare Lake. This lake used to be the biggest freshwater lake west of the Great Lakes. It was named after the tule rush plants that grew around its edges. Over time, the lake was drained for farming. Today, its former location is in Kings County. Kings County was created in 1893 from the western part of Tulare County.
Tulare County is part of the Visalia-Porterville area. It is located south of Fresno. The county stretches from the San Joaquin Valley in the west to the Sierra Nevada mountains in the east.
Sequoia National Park is in Tulare County. Part of Kings Canyon National Park is also here, sharing space with Fresno County. A part of Mount Whitney, the highest point in the lower 48 United States, is on the eastern border, shared with Inyo County.
Contents
History of Tulare County
.jpg)
For thousands of years, the land was home to the Yokuts people. In the 1700s, Spain began to settle California. They built missions to convert Native Americans to Christianity.
In 1772, a Spanish leader named Pedro Fages found a large lake. It was surrounded by marshes and full of rushes. He called it Los Tules, which means "the tules" (a type of plant). This is where the name Tulare comes from. The word Tulare comes from the Nahuatl word tullin, meaning cattail or similar reeds.
Spanish explorers visited Lake Tulare again in 1805, 1806, and 1816. Bubal was a Native American village near the lake. In 1816, a Spanish priest and soldiers arrived at Bubal. They tried to make the people send their children to the mission. A fight broke out, and Bubal was burned down.
The marshes around Lake Tulare made it hard for Spanish horses to pass. This gave the Yokuts an advantage in battles. The Spanish called the local natives Tulareños. Later, many joined missions like Mission San Miguel.
After Mexico became independent, California was part of Mexico. In 1848, the area became part of the United States. Tulare County was formed in 1852 from parts of Mariposa County. Some parts of Tulare County were later given to other counties. These include Fresno County in 1856, Kern County and Inyo County in 1866, and Kings County in 1893.
The disease Tularemia is named after Tulare County. It is caused by a type of bacteria.
In 1908, Colonel Allen Allensworth and his friends started the town of Allensworth. It was a farming community for African Americans. They wanted to create a place where Black people could live and succeed without unfair treatment. It was the only community in California started and run by African Americans. The town did well at first. But it faced problems when the water levels dropped. Today, the historic area is a park called Colonel Allensworth State Historic Park. It is a special place listed on the National Register of Historic Places.
Geography of Tulare County
Tulare County covers about 4,839 square miles. Most of this is land, with about 14 square miles of water.
Neighboring Counties
- Fresno County to the north
- Inyo County to the east
- Kern County to the south
- Kings County to the west
Lakes in Tulare County
.jpg)
- Arctic Lake
- Bullfrog Lakes
- Columbine Lake
- Crescent Lake
- Eagle Lake
- Franklin Lakes
- Lake Kaweah
- Lake Success
- Rockslide Lake
- Rocky Basin Lakes
- Weaver Lake
Rivers in Tulare County
- Angora River
- Alpine River
- Kaweah River
- Needlerock River
- Monarch River
- Negro River
- St. John's River
- Tule River
- Yokohl River
- Yucca River
Parks in Tulare County
- Colonel Allensworth State Historic Park
- Alpaugh Park
- Balch Park
- Bartlett Park
- Cutler Park
- Dry Creek Preserve
- Horse Creek Recreation Area
- Kaweah Oaks Preserve
- Kings River Nature Preserve
- Lackeys Cabin
- Lake Kaweah Recreation Area
- Mineral King Game Refuge
- Mooney Grove Park / Ancient Oak Forest Preserve
- Sequoia National Park
- Woodville Park
- West Main Street Park
National Protected Areas
- Blue Ridge National Wildlife Refuge
- Giant Sequoia National Monument (part)
- Inyo National Forest (part)
- Kings Canyon National Park (part)
- Pixley National Wildlife Refuge
- Sequoia National Forest (part)
- Sequoia National Park
Sequoia National Park

Sequoia National Park is a famous park in the southern Sierra Nevada mountains. It is east of Visalia. The park was created in 1890, making it the second national park in the U.S. after Yellowstone.
The park covers over 404,051 acres. It has a huge range of elevations, almost 13,000 feet from lowest to highest points. It is home to Mount Whitney, the tallest mountain in the lower 48 United States, which is 14,505 feet high. Sequoia National Park is next to Kings Canyon National Park. Both parks are managed together by the National Park Service.
Flora: Plants of Tulare County
Tulare County has many different native plants. This is because it has many different natural areas, like creeks, rivers, hills, and mountains. Some native plants you might see include:
- Incense cedar (Calocedrus decurrens)
- Valley oak (Quercus lobata)
- California bay (Umbellularia californica)
- Manzanita (Arctostaphylos manzanita)
- Salvia spathacea
- Mountain mahogany (Cercocarpus betuloides)
- Milkweed (Asclepias speciosa)
- Epilobium cleistogamum
- Monkeyflower (Mimulus)
- Penstemon
- California melic (Melica californica)
- Deer grass (Muhlenbergia rigens)
Transportation in Tulare County
Major Highways
 State Route 43
 State Route 63
 State Route 65
 State Route 99
 State Route 137
 State Route 180
 State Route 190
 State Route 198
 State Route 201
 State Route 216
 State Route 245
Public Transportation
Tulare County Area Transit (TCaT) offers bus services within the county. One TCaT route also connects to Delano in Kern County.
The cities of Tulare, Porterville, and Visalia have their own local bus services.
For longer trips outside the county, Greyhound Lines provides bus service.
Airports
The Porterville Municipal Airport is about 3 miles from Downtown Porterville. It is used for general aviation. It also has the Porterville Air Attack Base. The Visalia Municipal Airport is owned by the city of Visalia, California. Mefford Field is another airport in Tulare for general aviation.
For bigger flights, the closest commercial airports are Bakersfield's Meadows Field Airport to the south. Also, Fresno's Fresno Yosemite International Airport is to the north. Buses from V-LINE connect Visalia to the Fresno Airport every day.
People of Tulare County (Demographics)
| Historical population | |||
|---|---|---|---|
| Census | Pop. | %± | |
| 1860 | 4,638 | — | |
| 1870 | 4,533 | −2.3% | |
| 1880 | 11,281 | 148.9% | |
| 1890 | 24,574 | 117.8% | |
| 1900 | 18,375 | −25.2% | |
| 1910 | 35,440 | 92.9% | |
| 1920 | 59,031 | 66.6% | |
| 1930 | 77,442 | 31.2% | |
| 1940 | 107,152 | 38.4% | |
| 1950 | 149,264 | 39.3% | |
| 1960 | 168,403 | 12.8% | |
| 1970 | 188,322 | 11.8% | |
| 1980 | 245,738 | 30.5% | |
| 1990 | 311,921 | 26.9% | |
| 2000 | 368,021 | 18.0% | |
| 2010 | 442,179 | 20.2% | |
| 2020 | 473,117 | 7.0% | |
| 2023 (est.) | 479,468 | 8.4% | |
| U.S. Decennial Census 1790-1960 1900-1990 1990-2000 2010 2020 |
|||
2020 Census Information
In 2020, Tulare County had a population of 473,117 people.
- About 31.0% of the people were under 18 years old.
- 69.0% were between 18 and 64 years old.
- 6.5% were between 65 and 74 years old.
- 3.2% were between 75 and 84 years old.
- 1.4% were 85 years or older.
The average age in the county was 31 years.
The racial makeup of Tulare County in 2020 was:
- 39.4% White
- 1.4% African American
- 2.2% Native American
- 3.6% Asian
- 0.1% Pacific Islander
- 34.9% from other races
- 18.2% from two or more races.
Many people in Tulare County are of Hispanic or Latino background, making up 65.5% of the population.
In terms of languages spoken at home:
- 48.7% spoke English.
- 47.4% spoke Spanish.
- 1.0% spoke other Indo-European languages.
There were 144,109 households in the county.
- 45.9% of households had children under 18.
- 52.5% were married couples living together.
- The average household size was 3.20 people.
The average income for a household in the county was $57,692. About 18.8% of the population lived below the poverty line. This included 26.0% of those under 18.
Economy of Tulare County
Farming is a very important part of Tulare County's economy. The dairy industry, which sells milk products, brings in the most money. It usually earns over $1 billion each year. Oranges, grapes, and cattle also bring in hundreds of millions of dollars every year.
In 2001, Tulare became the county with the highest farming income in the U.S. It earned $3.5 billion that year. This was more than Fresno County, which had been the top farming county for over 20 years. Because farming is so important here, the city of Tulare has hosted the annual World Ag Expo since 1968. This is the biggest farming show in the world.
The county also has minor league sports teams. These include the Visalia Rawhide baseball team, which is part of the Arizona Diamondbacks. There are also football teams in Tulare and Visalia, and basketball teams in Porterville. These teams bring fun and entertainment to the county.
Top Employers in Tulare County
The biggest employers in Tulare County are:
- County of Tulare (5,106 employees)
- Visalia Unified School District (3,355 employees)
- Kaweah Delta Medical Center (2,000 employees)
- Sierra View District Hospital (1,800 employees)
- Ruiz Food Production, Inc (1,800 employees)
- Wal-Mart Distribution Center (1,692 employees)
- Porterville Developmental Center (1,173 employees)
- College of the Sequoias (1,160 employees)
- Jostens (720 employees)
- City of Visalia (653 employees)
Utilities and Infrastructure
Electricity in Tulare County is provided by Southern California Edison and PG&E. Gas service comes from SoCalGas and PG&E. Many companies offer TV and Internet services, such as Spectrum, DISH, DirecTV, and HughesNET.
Communities in Tulare County
Cities
- Dinuba
- Exeter
- Farmersville
- Lindsay
- Porterville
- Tulare
- Visalia (the county seat)
- Woodlake
Census-Designated Places (CDPs)
These are areas that are like towns but are not officially cities.
- Allensworth
- Alpaugh
- California Hot Springs
- Camp Nelson
- Cedar Slope
- Cutler
- Delft Colony
- Ducor
- Earlimart
- East Orosi
- East Porterville
- East Tulare Villa
- El Monte Mobile Village
- El Rancho
- Goshen
- Hartland
- Hypericum
- Idlewild
- Ivanhoe
- Jovista
- Kennedy Meadows
- Lemon Cove
- Lindcove
- Linnell Camp
- London
- Matheny
- McClenney Tract
- Monson
- Orosi
- Panorama Heights
- Patterson Tract
- Pierpoint
- Pine Flat
- Pixley
- Plainview
- Ponderosa
- Poplar-Cotton Center
- Posey
- Poso Park
- Richgrove
- Rodriguez Camp
- Sequoia Crest
- Seville
- Silver City
- Springville
- Strathmore
- Sugarloaf Saw Mill
- Sugarloaf Village
- Sultana
- Terra Bella
- Teviston
- Three Rivers
- Tipton
- Tonyville
- Tooleville
- Traver
- Waukena
- West Goshen
- Wilsonia
- Woodville
- Woodville Farm Labor Camp
- Yettem
Other Unincorporated Communities
These are smaller places that are not cities or CDPs.
- Advance
- Angiola
- Badger
- Balance Rock
- Cairns Corner
- Calgro
- Johnsondale
- Kaweah
- Rocky Hill
- Ultra
- White River
- Yokohl Valley
- Zante
Indian Reservation
Population Ranking of Communities (2020 Census)
This table shows the biggest communities in Tulare County based on the 2020 census.
† county seat
| Rank | City/Town/etc. | Type | Population (2020 Census) |
|---|---|---|---|
| 1 | † Visalia | City | 154,048 |
| 2 | Tulare | City | 77,101 |
| 3 | Porterville | City | 77,681 |
| 4 | Dinuba | City | 34,855 |
| 5 | Lindsay | City | 17,729 |
| 6 | Farmersville | City | 10,397 |
| 7 | Exeter | City | 10,334 |
| 8 | Orosi | CDP | 8,329 |
| 9 | Earlimart | CDP | 7,679 |
| 10 | East Porterville | CDP | 5,549 |
| 11 | Woodlake | City | 7,419 |
| 12 | Cutler | CDP | 4,480 |
| 13 | Ivanhoe | CDP | 4,468 |
| t-14 | Pixley | CDP | 3,828 |
| t-14 | Terra Bella | CDP | 2,910 |
| 15 | Goshen | CDP | 4,968 |
| 16 | Richgrove | CDP | 2,358 |
| 17 | Strathmore | CDP | 2,830 |
| 18 | Tipton | CDP | 2,519 |
| 19 | Poplar-Cotton Center | CDP | 2,370 |
| 20 | Three Rivers | CDP | 2,053 |
| 21 | London | CDP | 1,518 |
| 22 | Patterson Tract | CDP | 1,888 |
| 23 | Woodville | CDP | 1,680 |
| 24 | Teviston | CDP | 1,185 |
| 25 | Matheny | CDP | 1,125 |
| 26 | Tule River Reservation | AIAN | 1,250 |
| 27 | Alpaugh | CDP | 1,026 |
| 28 | Plainview | CDP | 871 |
| 29 | Springville | CDP | 967 |
| 30 | Linnell Camp | CDP | 696 |
| 31 | East Tulare Villa | CDP | 773 |
| 32 | Sultana | CDP | 779 |
| 33 | Traver | CDP | 731 |
| 34 | Ducor | CDP | 616 |
| 35 | West Goshen | CDP | 536 |
| 36 | East Orosi | CDP | 423 |
| 37 | Seville | CDP | 446 |
| 38 | Allensworth | CDP | 531 |
| 39 | Delft Colony | CDP | 412 |
| 40 | Lindcove | CDP | 189 |
| 41 | Tooleville | CDP | 286 |
| 42 | Tonyville | CDP | 329 |
| 43 | Lemon Cove | CDP | 298 |
| 44 | Yettem | CDP | 201 |
| 45 | Monson | CDP | 152 |
| 46 | Pine Flat | CDP | 206 |
| 47 | Rodriguez Camp | CDP | 133 |
| 48 | El Rancho | CDP | 96 |
| 49 | Waukena | CDP | 80 |
| 50 | Camp Nelson | CDP | 106 |
| 51 | Pierpoint | CDP | 59 |
| 52 | Idlewild | CDP | 32 |
| 53 | Panorama Heights | CDP | 44 |
| 54 | California Hot Springs | CDP | 50 |
| 55 | Hartland | CDP | 69 |
| 56 | Kennedy Meadows | CDP | 58 |
| 57 | Sugarloaf Saw Mill | CDP | 14 |
| 58 | Ponderosa | CDP | 51 |
| t-59 | McClenney Tract | CDP | 15 |
| t-59 | Posey | CDP | 23 |
| t-59 | Sequoia Crest | CDP | 24 |
| t-59 | Sugarloaf Village | CDP | 7 |
| 60 | Poso Park | CDP | 9 |
| 61 | Wilsonia | CDP | 14 |
| t-62 | Cedar Slope | CDP | 10 |
| t-62 | Silver City | CDP | 0 |
| t-62 | Sugarloaf Mountain Park | CDP | 0 |
Images for kids
-
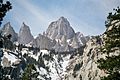
Mount Whitney is on the border of Tulare and Inyo counties.

See also
 In Spanish: Condado de Tulare para niños
