Lemon Cove, California facts for kids
Quick facts for kids
Lemon Cove
|
|
|---|---|
 |
|

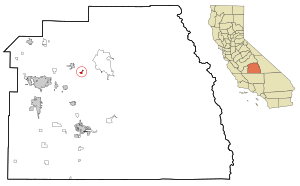
Location in Tulare County and the state of California
|
|
| Country | |
| State | |
| County | Tulare |
| Area | |
| • Total | 0.834 sq mi (2.159 km2) |
| • Land | 0.834 sq mi (2.159 km2) |
| • Water | 0 sq mi (0 km2) 0% |
| Elevation | 502 ft (153 m) |
| Population | |
| • Total | 308 |
| • Density | 369.3/sq mi (142.66/km2) |
| Time zone | UTC-8 (Pacific) |
| • Summer (DST) | UTC-7 (PDT) |
| ZIP code |
93244
|
| Area code | 559 |
| FIPS code | 06-41110 |
| GNIS feature IDs | 244733, 2408598 |
Lemon Cove is a small community in Tulare County, California, in the United States. It's called a "census-designated place" (CDP), which means it's a special area defined for counting people. In 2010, about 308 people lived there. This was a little more than the 298 people counted in 2000.
Contents
Where is Lemon Cove?
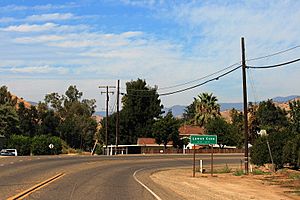
Lemon Cove is located in the San Joaquin Valley in California. It sits near where two waterways meet: Lime Kiln Creek and the Kaweah River. The area is about 0.8 square miles (2.159 square kilometers) in size. All of this area is land.
Plants and Animals in the Area
The area around Lemon Cove is home to many different plants and animals. You can find lots of wildflowers in the Lime Kiln Creek area. One example is the yellow mariposa lily, also known as Calochortus luteus.
What's the Weather Like?
Lemon Cove has a hot-summer Mediterranean climate. This means it has hot, dry summers and cool, wet winters. This type of weather is common in the foothills of California's Central Valley.
| Climate data for Lemon Cove, California (1991–2020 normals, extremes 1899–present) | |||||||||||||
|---|---|---|---|---|---|---|---|---|---|---|---|---|---|
| Month | Jan | Feb | Mar | Apr | May | Jun | Jul | Aug | Sep | Oct | Nov | Dec | Year |
| Record high °F (°C) | 82 (28) |
87 (31) |
93 (34) |
110 (43) |
118 (48) |
115 (46) |
118 (48) |
115 (46) |
115 (46) |
103 (39) |
92 (33) |
86 (30) |
118.0 (47.8) |
| Mean maximum °F (°C) | 70.5 (21.4) |
76.4 (24.7) |
84.2 (29.0) |
92.2 (33.4) |
100.2 (37.9) |
106.4 (41.3) |
107.8 (42.1) |
107.0 (41.7) |
103.7 (39.8) |
95.4 (35.2) |
82.5 (28.1) |
70.3 (21.3) |
109.4 (43.0) |
| Mean daily maximum °F (°C) | 59.5 (15.3) |
65.1 (18.4) |
71.2 (21.8) |
77.2 (25.1) |
85.7 (29.8) |
94.3 (34.6) |
100.1 (37.8) |
99.3 (37.4) |
93.9 (34.4) |
82.9 (28.3) |
68.7 (20.4) |
59.2 (15.1) |
79.8 (26.5) |
| Daily mean °F (°C) | 48.9 (9.4) |
53.2 (11.8) |
58.0 (14.4) |
62.3 (16.8) |
69.6 (20.9) |
76.9 (24.9) |
82.5 (28.1) |
81.2 (27.3) |
76.3 (24.6) |
67.0 (19.4) |
55.7 (13.2) |
48.2 (9.0) |
65.0 (18.3) |
| Mean daily minimum °F (°C) | 38.3 (3.5) |
41.4 (5.2) |
44.7 (7.1) |
47.4 (8.6) |
53.5 (11.9) |
59.4 (15.2) |
64.9 (18.3) |
63.1 (17.3) |
58.7 (14.8) |
51.0 (10.6) |
42.7 (5.9) |
37.3 (2.9) |
50.2 (10.1) |
| Mean minimum °F (°C) | 29.8 (−1.2) |
32.4 (0.2) |
34.7 (1.5) |
36.8 (2.7) |
42.7 (5.9) |
48.0 (8.9) |
56.8 (13.8) |
55.4 (13.0) |
48.5 (9.2) |
41.7 (5.4) |
33.6 (0.9) |
29.5 (−1.4) |
28.2 (−2.1) |
| Record low °F (°C) | 15 (−9) |
20 (−7) |
25 (−4) |
27 (−3) |
31 (−1) |
38 (3) |
36 (2) |
38 (3) |
36 (2) |
26 (−3) |
20 (−7) |
19 (−7) |
15 (−9) |
| Average precipitation inches (mm) | 2.68 (68) |
2.33 (59) |
2.48 (63) |
1.42 (36) |
0.62 (16) |
0.15 (3.8) |
0.02 (0.51) |
0.00 (0.00) |
0.06 (1.5) |
0.67 (17) |
1.33 (34) |
2.29 (58) |
14.05 (356.81) |
| Average precipitation days | 8.5 | 8.4 | 7.5 | 4.9 | 2.9 | 0.5 | 0.3 | 0.1 | 0.7 | 2.5 | 4.7 | 7.3 | 48.3 |
| Source: NOAA | |||||||||||||
Who Lives in Lemon Cove?
| Historical population | |||
|---|---|---|---|
| Census | Pop. | %± | |
| U.S. Decennial Census | |||
This section shares information about the people living in Lemon Cove. This data comes from the United States Census, which counts everyone in the country.
Population in 2010
In 2010, the population of Lemon Cove was 308 people. This means there were about 369 people for every square mile.
- Most people (84.7%) were White.
- About 1.6% were Native American.
- About 1.0% were Asian.
- A small number (0.6%) were Pacific Islander.
- Some people (3.9%) were from other races.
- About 8.1% of the population identified as two or more races.
- Around 24.7% of the people were Hispanic or Latino.
All 308 people lived in homes. No one lived in group homes or institutions at that time.
There were 120 households in Lemon Cove.
- 39 households (32.5%) had children under 18 living there.
- 53 households (44.2%) were married couples.
- 19 households (15.8%) had a female head of household with no husband.
- 7 households (5.8%) had a male head of household with no wife.
- The average household had about 2.57 people.
- There were 79 families, with an average of 3.16 people per family.
The ages of the people in Lemon Cove were spread out:
- 26.6% were under 18 years old.
- 10.4% were between 18 and 24 years old.
- 18.8% were between 25 and 44 years old.
- 29.9% were between 45 and 64 years old.
- 14.3% were 65 years or older.
The average age was about 39.6 years. For every 100 females, there were about 106.7 males.
There were 153 housing units in Lemon Cove.
- 77 homes (64.2%) were owned by the people living in them.
- 43 homes (35.8%) were rented.
- Most people (65.6%) lived in homes they owned.
- About 34.4% of the population lived in rented homes.
Population in 2000
In 2000, Lemon Cove had 298 people. There were about 355 people per square mile.
- Most people (87.25%) were White.
- About 4.70% were Native American.
- About 2.01% were Asian.
- Around 12.08% of the population was Hispanic or Latino.
There were 121 households.
- 26.4% had children under 18.
- 52.1% were married couples.
- The average household size was 2.46 people.
- The average family size was 3.18 people.
The ages of the people in 2000:
- 26.2% were under 18.
- 15.4% were 65 or older.
The average age was 39 years.
Famous People from Lemon Cove
- Willard Hershberger – a baseball player.
- Susan Peters – an actress.
See also
 In Spanish: Lemon Cove para niños
 | George Robert Carruthers |
 | Patricia Bath |
 | Jan Ernst Matzeliger |
 | Alexander Miles |


