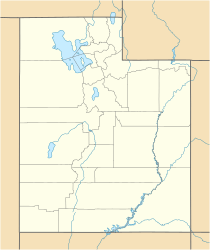
Logan Peak facts for kids
Quick facts for kids Logan Peak |
|
|---|---|
| Highest point | |
| Elevation | 9,714 ft (2,961 m) NAVD 88 |
| Prominence | 2,995 ft (913 m) |
| Geography | |
| Location | Cache County, Utah, U.S. |
| Parent range | Bear River Mountains |
| Topo map | USGS Logan Peak |
| Climbing | |
| Easiest route | Hiking trail or rugged jeep trail |
Logan Peak, sometimes called Mount Logan, is a tall mountain in the Bear River Mountains. These mountains are part of the bigger Wasatch Range in Utah, U.S.. Logan Peak is located about six miles (or 9.6 kilometers) east of Logan, Utah. It's inside the Uinta-Wasatch-Cache National Forest.
This mountain is the second highest peak that looks over Cache Valley. Only Mount Naomi is taller. Logan Peak stands at an elevation of 9,714 feet (about 2,961 meters) above sea level.
What makes Logan Peak special is that it's the only mountain in the Bear River Range with a road that goes all the way to its top! This road is narrow and unpaved, so you need a special off-road vehicle to use it.
At the very top of Logan Peak, you'll find a weather station and a tower for telecommunications. This helps us learn about the weather and stay connected.
Fun Things to Do at Logan Peak
Logan Peak is a popular spot for outdoor adventures.
Hiking and Biking
During the warmer months, many people enjoy hiking and mountain biking on the trails. It's a great way to get exercise and see amazing views.
Winter Activities
When winter arrives, the mountain transforms. Advanced cross-country skiers love the snowy trails. There's also a special circular area on the east side of the peak. It's called Crystal Valley and is a favorite spot for snowmobilers.
Weather at Logan Peak
The weather on Logan Peak can be quite different from the valley below. Here's a look at the average temperatures and rainfall.
| Climate data for Logan Peak 41.7101 N, 111.7197 W, Elevation: 9,285 ft (2,830 m) (1991–2020 normals) | |||||||||||||
|---|---|---|---|---|---|---|---|---|---|---|---|---|---|
| Month | Jan | Feb | Mar | Apr | May | Jun | Jul | Aug | Sep | Oct | Nov | Dec | Year |
| Mean daily maximum °F (°C) | 27.3 (−2.6) |
28.4 (−2.0) |
32.8 (0.4) |
39.3 (4.1) |
49.4 (9.7) |
61.4 (16.3) |
72.6 (22.6) |
71.4 (21.9) |
61.1 (16.2) |
46.8 (8.2) |
34.4 (1.3) |
26.9 (−2.8) |
46.0 (7.8) |
| Daily mean °F (°C) | 19.8 (−6.8) |
19.6 (−6.9) |
24.5 (−4.2) |
29.8 (−1.2) |
39.8 (4.3) |
50.6 (10.3) |
60.2 (15.7) |
59.1 (15.1) |
49.7 (9.8) |
37.0 (2.8) |
26.1 (−3.3) |
19.5 (−6.9) |
36.3 (2.4) |
| Mean daily minimum °F (°C) | 12.3 (−10.9) |
10.7 (−11.8) |
16.2 (−8.8) |
20.4 (−6.4) |
30.2 (−1.0) |
39.9 (4.4) |
47.9 (8.8) |
46.9 (8.3) |
38.3 (3.5) |
27.2 (−2.7) |
17.8 (−7.9) |
12.1 (−11.1) |
26.7 (−3.0) |
| Average precipitation inches (mm) | 6.27 (159) |
4.74 (120) |
4.28 (109) |
3.91 (99) |
3.28 (83) |
1.70 (43) |
0.95 (24) |
1.34 (34) |
2.08 (53) |
3.22 (82) |
4.15 (105) |
5.12 (130) |
41.04 (1,041) |
| Source: PRISM Climate Group | |||||||||||||
 | Sharif Bey |
 | Hale Woodruff |
 | Richmond Barthé |
 | Purvis Young |


