Long Creek, Oregon facts for kids
Quick facts for kids
Long Creek, Oregon
|
|
|---|---|

Houses in Long Creek
|
|

Location in Oregon
|
|
| Country | United States |
| State | Oregon |
| County | Grant |
| Incorporated | 1891 |
| Area | |
| • Total | 1.02 sq mi (2.65 km2) |
| • Land | 1.02 sq mi (2.65 km2) |
| • Water | 0.00 sq mi (0.00 km2) |
| Elevation | 3,744 ft (1,141 m) |
| Population
(2020)
|
|
| • Total | 173 |
| • Density | 169.11/sq mi (65.32/km2) |
| Time zone | UTC-8 (Pacific) |
| • Summer (DST) | UTC-7 (Pacific) |
| ZIP code |
97856
|
| Area code(s) | 541 |
| FIPS code | 41-43550 |
| GNIS feature ID | 2410868 |
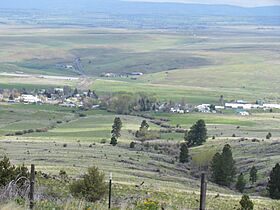
Long Creek is a small city in Grant County, Oregon, a state in the western United States. In 2020, about 173 people lived there. The city got its name from John Long, who was a miner who arrived in the area in 1862.
Long Creek is nestled in a high valley within the Blue Mountains. For a long time, ranching was the main activity here. There used to be a lot of tree cutting in the nearby Malheur National Forest. This activity slowed down, and the local mill closed in 1998.
Contents
A Look Back in Time
Long Creek became an official city in 1891. In 1900, the city had 123 residents. The number of people living there changed over the years.
- In 1910, the population dropped to 86.
- By 1920, it grew to 148.
- In the middle of the 20th century, the city saw steady growth.
- The population reached its highest point in 1960 with 295 residents.
- After that, the population started to decrease again.
Where is Long Creek?
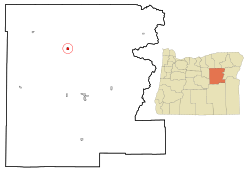
Long Creek is located in Oregon. The United States Census Bureau says the city covers about 1.02 square miles (2.65 square kilometers) of land. There is no water area within the city limits.
What's the Weather Like?
Long Creek has warm, dry summers. The average monthly temperatures usually stay below 71.6°F (22°C). Even though it's far from the ocean, it has a climate similar to coastal areas. This is called an oceanic climate. However, its cold winters almost make it a humid continental climate.
| Climate data for Long Creek, Oregon (1991–2020 normals, extremes 1957–2021) | |||||||||||||
|---|---|---|---|---|---|---|---|---|---|---|---|---|---|
| Month | Jan | Feb | Mar | Apr | May | Jun | Jul | Aug | Sep | Oct | Nov | Dec | Year |
| Record high °F (°C) | 67 (19) |
69 (21) |
77 (25) |
88 (31) |
94 (34) |
101 (38) |
106 (41) |
108 (42) |
102 (39) |
88 (31) |
75 (24) |
65 (18) |
108 (42) |
| Mean daily maximum °F (°C) | 40.4 (4.7) |
44.0 (6.7) |
50.4 (10.2) |
56.3 (13.5) |
65.1 (18.4) |
72.6 (22.6) |
84.0 (28.9) |
84.7 (29.3) |
75.6 (24.2) |
61.5 (16.4) |
47.4 (8.6) |
39.3 (4.1) |
60.1 (15.6) |
| Daily mean °F (°C) | 31.4 (−0.3) |
33.7 (0.9) |
38.8 (3.8) |
43.6 (6.4) |
51.1 (10.6) |
57.1 (13.9) |
65.3 (18.5) |
65.4 (18.6) |
57.9 (14.4) |
47.3 (8.5) |
37.3 (2.9) |
30.4 (−0.9) |
46.6 (8.1) |
| Mean daily minimum °F (°C) | 22.3 (−5.4) |
23.5 (−4.7) |
27.3 (−2.6) |
30.9 (−0.6) |
37.1 (2.8) |
41.5 (5.3) |
46.7 (8.2) |
46.1 (7.8) |
40.1 (4.5) |
33.0 (0.6) |
27.2 (−2.7) |
21.6 (−5.8) |
33.1 (0.6) |
| Record low °F (°C) | −23 (−31) |
−21 (−29) |
2 (−17) |
9 (−13) |
17 (−8) |
22 (−6) |
28 (−2) |
26 (−3) |
17 (−8) |
−1 (−18) |
−10 (−23) |
−25 (−32) |
−25 (−32) |
| Average precipitation inches (mm) | 1.60 (41) |
1.35 (34) |
1.70 (43) |
1.76 (45) |
2.34 (59) |
1.48 (38) |
0.62 (16) |
0.57 (14) |
0.66 (17) |
1.60 (41) |
1.65 (42) |
1.83 (46) |
17.16 (436) |
| Average snowfall inches (cm) | 7.2 (18) |
5.6 (14) |
5.8 (15) |
2.3 (5.8) |
0.1 (0.25) |
0.0 (0.0) |
0.0 (0.0) |
0.0 (0.0) |
0.0 (0.0) |
0.3 (0.76) |
3.6 (9.1) |
8.2 (21) |
33.1 (84) |
| Average precipitation days (≥ 0.01 in) | 12.5 | 11.2 | 13.3 | 13.5 | 11.8 | 8.0 | 3.2 | 3.0 | 4.1 | 9.2 | 11.4 | 12.2 | 113.4 |
| Average snowy days (≥ 0.1 in) | 4.6 | 4.2 | 4.0 | 2.0 | 0.1 | 0.1 | 0.0 | 0.0 | 0.0 | 0.4 | 2.8 | 5.3 | 23.5 |
| Source: NOAA | |||||||||||||
Who Lives in Long Creek?
| Historical population | |||
|---|---|---|---|
| Census | Pop. | %± | |
| 1890 | 60 | — | |
| 1900 | 123 | 105.0% | |
| 1910 | 86 | −30.1% | |
| 1920 | 148 | 72.1% | |
| 1930 | 139 | −6.1% | |
| 1940 | 238 | 71.2% | |
| 1950 | 288 | 21.0% | |
| 1960 | 295 | 2.4% | |
| 1970 | 196 | −33.6% | |
| 1980 | 252 | 28.6% | |
| 1990 | 249 | −1.2% | |
| 2000 | 228 | −8.4% | |
| 2010 | 197 | −13.6% | |
| 2020 | 173 | −12.2% | |
| U.S. Decennial Census | |||
Every ten years, the United States counts its population in a process called a census. The numbers help us understand how communities are growing or changing.
The 2010 Census in Long Creek
In 2010, the census showed that 197 people lived in Long Creek. There were 84 households, which are groups of people living together in one home. About 52 families lived in the city.
The average age of people in Long Creek was about 47.2 years old.
- About 20.8% of the residents were under 18 years old.
- About 18.3% were 65 years old or older.
- The city had slightly more females (51.8%) than males (48.2%).
See also
 In Spanish: Long Creek (Oregón) para niños
 | Georgia Louise Harris Brown |
 | Julian Abele |
 | Norma Merrick Sklarek |
 | William Sidney Pittman |

