
Longyearbyen facts for kids
Quick facts for kids
Longyearbyen
|
||
|---|---|---|
 .jpg) .jpg)       Panoramic, Aurora Borealis, Longyearbyen at night, Global Seed Vault, Church in Longyearbyen, Bjørndalen base station, houses in Longyearbyen, The Culture House, view of the city.
|
||
|
||

Location of Longyearbyen (red) in Svalbard
|
||

Longyearbyen
Location in Arctic
.svg)
Longyearbyen
Location in Earth
|
||
| Sovereign state | ||
| Territory | Svalbard | |
| Island | Spitsbergen | |
| Founded | 1907 | |
| Incorporated | 1 January 2002 | |
| Area | ||
| • Total | 10 km2 (4 sq mi) | |
| Population
(2020)
|
||
| • Total | 1,753 | |
| • Density | 180/km2 (450/sq mi) | |

Longyearbyen (pronounced "Long-yer-by-en") is the world's northernmost town with more than 1,000 people. It is the largest inhabited area on Svalbard, Norway. This unique town sits along the Longyear Valley and near the shore of Adventfjorden. This is a short water passage that leads into Isfjorden on the west coast of Spitsbergen. Since 2002, Longyearbyen has been an official Norwegian municipality. It is also where the Governor of Svalbard works.
The town was once called Longyear City. It was founded in 1906 by an American named John Munro Longyear. His company, the Arctic Coal Company, started coal-mining here. Later, in 1916, another company called Store Norske Spitsbergen Kulkompani (SNSK) took over the mining. The town was almost completely destroyed during Second World War in 1943 but was rebuilt. Longyearbyen used to be a "company town," meaning one company ran most things. However, mining mostly stopped by 2017. Now, the town is known for tourism and research. Important places like the University Centre in Svalbard, the Svalbard Global Seed Vault, and the Svalbard Satellite Station are located here. The community also has Svalbard Airport, Svalbard Church, and the Svalbardbutikken department store.
Contents
History of Longyearbyen


Longyearbyen's story began with early tourism and coal discovery. In 1896, a company started tours to the area and built a hotel. However, it didn't make money and closed. The first successful coal mining started in 1899.
How the Town Was Founded
In 1901, an American businessman, John Munro Longyear, visited Spitsbergen. He learned about the coal fields. In 1903, he bought land with coal claims. In 1906, his company, the Arctic Coal Company, began mining. They built docks and homes. The town was named Longyear City after him. Coal was moved from the mine to the port using a special cable car system.
Growth and Changes Over Time

During the First World War, the mining company faced money problems. In 1916, a Norwegian company called Store Norske took over. They built new buildings, including a hospital. In 1918, a flu outbreak led to a graveyard being created. After a mine explosion in 1920, the mine closed, and others were made safer.
In 1920, a church and a school were built. The school started with eight students. In 1926, Longyear City was officially renamed Longyearbyen. A radio station was set up in 1930, connecting the town to the mainland. Tourism began to grow in 1935 with regular ship visits. Roads were built, and more mines opened.
Longyearbyen During World War II

Svalbard was not directly involved in the war at first. But it became important for supplying goods to the Allies. In 1941, the people of Longyearbyen were safely moved to Scotland. A small German group briefly took over for weather reports. In September 1943, German warships attacked the town. Most buildings were destroyed. Only a few, like the hospital and power station, survived. The town remained empty until the war ended in 1945.
Rebuilding and Modern Times
After the war, plans were made to rebuild quickly. By 1948, coal production was back to normal. New housing was built, and a local newspaper started. In 1949, Longyearbyen got a telephone connection. A farm was built to provide milk and food. A local radio station began broadcasting in 1950. The graveyard stopped being used because bodies did not decompose in the frozen ground.
In the 1950s, postal flights began. Later, planes started making irregular winter landings. A new church and school were opened. Snowmobiles became popular for transport. In the 1970s, a new school building with a gym and swimming pool opened. The Svalbard Council was formed to help govern the town. The airport opened in 1975, connecting Longyearbyen to mainland Norway.
Becoming a Modern Community
_2003.jpg)
In the 1980s, Longyearbyen slowly changed from a company town. People could now own cars. The main mining company, Store Norske, moved its main office to Longyearbyen. A new company, Svalbard Samfunnsdrift (SSD), was created to manage public services like healthcare, roads, and power.
In the 1990s, the government worked to make Longyearbyen a more "normal" town. New businesses opened, and local democracy was introduced. The Longyearbyen Community Council was set up in 2002. This council took over many responsibilities, similar to a regular municipality.
Science also grew in Longyearbyen. The University Centre in Svalbard (UNIS) opened in 1993. Mobile phone service arrived in 1995. In 2004, an undersea fiber-optic cable connected Svalbard to the mainland. Important research facilities like the European Incoherent Scatter Scientific Association (EISCAT) radar, Svalbard Satellite Station, and the Svalbard Global Seed Vault were also established.
Geography of Longyearbyen


Longyearbyen is located in the lower part of the Longyear Valley. It sits along the Longyear River. The town's lower areas are next to Adventfjorden, a bay that connects to Isfjorden. Longyearbyen is on the Nordenskiöld Land peninsula of Spitsbergen. This is the largest island in the Svalbard group.
Town Layout and Nearby Areas
Across the bay from Longyearbyen are the old, empty towns of Advent City and Hiorthhamn. Longyearbyen is the world's second northernmost town. Other settlements further north are mostly research or weather stations.
Longyearbyen has different neighborhoods. On the west side of the river, near the bay, are the port and industrial areas. Further up the valley on the west side is "Old Longyearbyen" and the church. The graveyard, a community center called Huset, and the cinema are also there. Most homes, shops, and cultural places are on the east side of the river. The university, the largest residential area (Gruvedalen), and the main shopping area are here. The school is in the Haugen area. At the very end of the valley is Nybyen, which is mainly student housing. The airport is west of town, near Hotellneset.

Climate and Weather

Svalbard has a polar tundra climate. This means it's very cold and dry. However, the North Atlantic Current makes the west coast, where Longyearbyen is, a bit warmer and wetter. Longyearbyen has less humidity than other places in the Arctic Circle.
The town experiences midnight sun from April 18 to August 23. This means the sun never sets during this time. The polar night lasts from October 27 to February 15. During this period, the sun never rises. Because of the mountains, the sun isn't visible in Longyearbyen until around March 8. Snow usually covers the town from November to March.
Longyearbyen is one of the fastest-warming places on Earth. Since 1971, temperatures on Svalbard have risen much faster than the global average. Winters are now much warmer than they were in the 1970s. In 2020, Longyearbyen had its hottest temperature ever recorded. The amount of rain and snow has also increased. The ground, which is usually frozen (called permafrost), is also getting warmer.
Longyearbyen has the lowest average UV index of any inhabited place. From April to September, the UV index is usually very low (1 or 2). For the rest of the year, it's 0.
| Climate data for Svalbard Airport Longyearbyen 1991–2020 (28 m, extremes 1975–2022) | |||||||||||||
|---|---|---|---|---|---|---|---|---|---|---|---|---|---|
| Month | Jan | Feb | Mar | Apr | May | Jun | Jul | Aug | Sep | Oct | Nov | Dec | Year |
| Record high °C (°F) | 7.7 (45.9) |
7 (45) |
6.3 (43.3) |
7.5 (45.5) |
12.9 (55.2) |
15.7 (60.3) |
21.7 (71.1) |
20.3 (68.5) |
15.2 (59.4) |
10.1 (50.2) |
9.2 (48.6) |
8.7 (47.7) |
21.7 (71.1) |
| Mean daily maximum °C (°F) | −7.7 (18.1) |
−8.3 (17.1) |
−8.8 (16.2) |
−5.7 (21.7) |
−0.6 (30.9) |
5.6 (42.1) |
9.4 (48.9) |
8.2 (46.8) |
4 (39) |
−1.5 (29.3) |
−3.8 (25.2) |
−6.1 (21.0) |
−1.3 (29.7) |
| Daily mean °C (°F) | −10.9 (12.4) |
−11.6 (11.1) |
−12 (10) |
−8.8 (16.2) |
−2.2 (28.0) |
3.6 (38.5) |
7 (45) |
6 (43) |
2 (36) |
−3.8 (25.2) |
−6.4 (20.5) |
−9.2 (15.4) |
−3.9 (25.1) |
| Mean daily minimum °C (°F) | −14.2 (6.4) |
−15 (5) |
−15.5 (4.1) |
−12.1 (10.2) |
−3.9 (25.0) |
2.2 (36.0) |
5.4 (41.7) |
4.4 (39.9) |
0.3 (32.5) |
−6.1 (21.0) |
−9.3 (15.3) |
−12.2 (10.0) |
−6.3 (20.6) |
| Record low °C (°F) | −38.8 (−37.8) |
−43.7 (−46.7) |
−46.3 (−51.3) |
−39.1 (−38.4) |
−21.7 (−7.1) |
−8.4 (16.9) |
−0.7 (30.7) |
−3.9 (25.0) |
−12.6 (9.3) |
−20.8 (−5.4) |
−33.2 (−27.8) |
−35.6 (−32.1) |
−46.3 (−51.3) |
| Average precipitation mm (inches) | 21 (0.8) |
17 (0.7) |
16 (0.6) |
9 (0.4) |
8 (0.3) |
8 (0.3) |
20 (0.8) |
23 (0.9) |
26 (1.0) |
18 (0.7) |
22 (0.9) |
24 (0.9) |
212 (8.3) |
| Source 1: Norwegian Meteorological Institute | |||||||||||||
| Source 2: Meteostat | |||||||||||||
| Climate data for Longyearbyen (1961–1990) | |||||||||||||
|---|---|---|---|---|---|---|---|---|---|---|---|---|---|
| Month | Jan | Feb | Mar | Apr | May | Jun | Jul | Aug | Sep | Oct | Nov | Dec | Year |
| Record high °C (°F) | 9.7 (49.5) |
7.0 (44.6) |
6.3 (43.3) |
7.5 (45.5) |
10.6 (51.1) |
15.7 (60.3) |
21.7 (71.1) |
18.1 (64.6) |
15.2 (59.4) |
8.9 (48.0) |
7.5 (45.5) |
8.7 (47.7) |
21.7 (71.1) |
| Mean daily maximum °C (°F) | −13.0 (8.6) |
−13.0 (8.6) |
−13.0 (8.6) |
−9.0 (15.8) |
−3.0 (26.6) |
3.0 (37.4) |
7.0 (44.6) |
6.0 (42.8) |
1.0 (33.8) |
−4.0 (24.8) |
−8.0 (17.6) |
−11.0 (12.2) |
−4.7 (23.5) |
| Daily mean °C (°F) | −16.5 (2.3) |
−17.0 (1.4) |
−16.5 (2.3) |
−12.5 (9.5) |
−5.0 (23.0) |
1.0 (33.8) |
5.0 (41.0) |
4.0 (39.2) |
−1.0 (30.2) |
−6.5 (20.3) |
−11.0 (12.2) |
−14.5 (5.9) |
−7.5 (18.4) |
| Mean daily minimum °C (°F) | −20.0 (−4.0) |
−21.0 (−5.8) |
−20.0 (−4.0) |
−16.0 (3.2) |
−7.0 (19.4) |
−1.0 (30.2) |
3.0 (37.4) |
2.0 (35.6) |
−3.0 (26.6) |
−9.0 (15.8) |
−14.0 (6.8) |
−18.0 (−0.4) |
−10.3 (13.4) |
| Record low °C (°F) | −38.8 (−37.8) |
−43.7 (−46.7) |
−46.3 (−51.3) |
−39.1 (−38.4) |
−21.7 (−7.1) |
−8.4 (16.9) |
0.2 (32.4) |
−3.9 (25.0) |
−12.6 (9.3) |
−20.8 (−5.4) |
−33.2 (−27.8) |
−35.6 (−32.1) |
−46.3 (−51.3) |
| Average precipitation mm (inches) | 22.0 (0.87) |
28.0 (1.10) |
29.0 (1.14) |
16.0 (0.63) |
13.0 (0.51) |
18.0 (0.71) |
24.0 (0.94) |
30.0 (1.18) |
25.0 (0.98) |
19.0 (0.75) |
22.0 (0.87) |
25.0 (0.98) |
271 (10.66) |
| Average rainy days (≥ 1 mm) | 2 | 2 | 2 | 3 | 4 | 13 | 17 | 18 | 14 | 5 | 3 | 3 | 86 |
| Average snowy days (≥ 1 cm) | 21 | 17 | 19 | 17 | 16 | 7 | 1 | 2 | 11 | 21 | 22 | 22 | 176 |
| Mean monthly sunshine hours | 0.0 | 0.0 | 77.5 | 228.0 | 254.2 | 165.0 | 155.0 | 133.3 | 75.0 | 12.4 | 0.0 | 0.0 | 1,102 |
| Percent possible sunshine | 0.0 | 0.0 | 22.1 | 36.4 | 34.2 | 22.9 | 20.8 | 18.7 | 17.4 | 6.2 | 0.0 | 0.0 | 25 |
| Average ultraviolet index | 0 | 0 | 0 | 1 | 2 | 2 | 2 | 1 | 1 | 0 | 0 | 0 | 0.75 |
| Source 1: nordicvisitor.com | |||||||||||||
| Source 2: UNIS (extremes only) (sun only) and Weather Atlas (UV index) | |||||||||||||
People and Community

In 2020, Longyearbyen had 1,753 people. Many Norwegians living here come from Northern Norway. About 300 people (16%) are from other countries. The largest groups are from Thailand, Sweden, Russia, and Ukraine. Because of the mining history, more adults are male than female. Longyearbyen has many people aged 25 to 44. However, there are almost no residents over 66 years old.
Thai Community in Longyearbyen
Thai people are the second largest group of residents after Norwegians. Many Thai residents work as cleaners. Most stay for two to three years to save money. The Thai community is very active in cultural events. They even helped start a Thai supermarket.
Moving In and Out
Longyearbyen has a high number of people moving in and out. In 2008, 23% of the town's population moved away. On average, people live in Longyearbyen for about 6.3 years. This is shorter than in mainland Norway. Students and people in tourism often stay for the shortest time. This constant movement creates a "revolving door society."
Most homes in Longyearbyen have only one person living in them. This is different from mainland Norway. Many people work in Svalbard while their families live on the mainland. The people in Longyearbyen are generally well-educated. More people have higher education than the national average.
Culture and Activities
The local council offers many cultural activities. These include a cinema, a youth club, a library, and an art gallery. The Svalbard Church serves the entire archipelago. There are two museums in town: the Svalbard Museum and the Spitsbergen Airship Museum.
Festivals and Events
Solfestuka (Sun Festival Week) happens every year around March 8. This is when the sun first becomes visible in most of the town after the long polar night. Dark Season Blues is a music festival held in October. Polarjazz is another music festival held in late January or early February. The Arctic Film Festival is an annual film festival held at the Kulturhuset, the town's cultural center.
Sports and Recreation
The town's main sports club is Svalbard Turn. The Svalbardhallen is an indoor sports center. It has a large hall for sports like handball and badminton. It also has a shooting range, a climbing wall, and a 25-meter swimming pool.
Longyearbyen does not have outdoor sports fields. However, Svalbard Turn organizes outdoor events. These include the Spitsbergen Marathon, the Svalbard Skimaraton (a ski race), and an annual orienteering race.
Media and Communication
Svalbardposten is a weekly newspaper published on Fridays. Most people who subscribe to it live on the mainland. Icepeople is another newspaper, published weekly in English.
Television broadcasts of NRK1 (Norwegian Broadcasting Corporation) started in 1969. At first, they were delayed by two weeks. Since 1984, programs have been broadcast live. This means Svalbard is now included in national weather reports. Radio stations like NRK P1, P4, and Radio Norge are available. DAB radio broadcasting began in 2016. The town has fast internet thanks to the Svalbard Undersea Cable System.
Economy and Jobs

Coal production in Longyearbyen reached its highest point in 2007. Now, the only active mine is Mine 7. This mine produces coal that is used to power the Longyear Power Station. This is Norway's only power station that runs on coal.
Most of the mining company's production used to happen at Sveagruva. This town is 60 km south of Longyearbyen. There are no roads connecting the two communities. Workers lived in dorms in Svea until it closed in 2017. Mining has not been very profitable. The company relies on government help to keep producing coal.
New Economic Opportunities

Global warming has had an unexpected effect on fishing in Svalbard. Fish like Atlantic cod, mackerel, and snow crabs are moving north to Svalbard. This is because their usual waters are getting warmer. This has increased the local fish catch.
The University Centre in Svalbard (UNIS) is a major part of the economy. It has 350 students and many professors. UNIS offers courses in biology, physics, and geology. Student housing is in Nybyen. UNIS is part of the Svalbard Science Centre. This center also includes the Norwegian Polar Institute and other research groups. Longyearbyen is an important place for research.
The Svalbard Satellite Station is located here because it's a great spot to download data from satellites in polar orbit. It helps study the northern lights. The Svalbard Global Seed Vault is a very important facility. It's a secure underground vault that stores millions of different crop seeds. It's designed to protect against natural disasters and other global problems. The location was chosen for its remoteness and the naturally frozen ground (permafrost).
Tourism in Longyearbyen
Longyearbyen is the main center for tourism in Svalbard. Most tourists come to experience the natural beauty of the area. However, Longyearbyen provides all the necessary services. These include shops, places to stay, and museums. In 2008, Longyearbyen had 89,000 guest-nights. This was a big increase from 1995. Most tourists stay for about two nights. About two-thirds of the tourists are from Norway. Tourism brings a lot of money and jobs to the area.
Education in Longyearbyen


The Longyearbyen School teaches students from ages 6 to 18. It is the northernmost primary and secondary school in the world. Many families move to mainland Norway when their children reach 16 or 17.
The University Centre in Svalbard (UNIS) is a higher education institution in Longyearbyen. It shares a building with the Norwegian Polar Institute and the Svalbard Museum. UNIS does not offer full degrees. Instead, it provides semester-long courses in science.
The Czech Arctic Research Station is also in Longyearbyen. It offers facilities for researchers and students from all over the world.
Transportation in Longyearbyen
Longyearbyen has about 50 km of roads. However, these roads do not connect to any other communities. In 2008, there were 1,481 registered vehicles. Almost half of all homes had a car. Cars in Longyearbyen have special ZN license plates. There is one car dealer and repair shop in town.
Getting Around and Beyond
Snowmobiles are a very popular way to get around. There are more snowmobiles than people in Longyearbyen. In 2008, there were 2,672 registered snowmobiles. Most homes owned at least one. It is not allowed to drive motorized vehicles off-road on bare ground. But snowmobiles are used a lot in winter for fun and for work. You can travel from Longyearbyen to Barentsburg (45 km) and Pyramiden (100 km) by snowmobile in winter. You can also travel by ship year-round.
Air and Sea Travel
Svalbard Airport, Longyear is located 3 km northwest of town. It has a long runway. It is the only airport allowed to serve planes from the archipelago. Scandinavian Airlines has daily flights to Oslo and Tromsø in mainland Norway. There are also occasional flights to Russia. Other airlines operate charter flights to smaller airports in Svalbard. Helicopters are used to travel to Barentsburg and Pyramiden.
Longyearbyen has two docks. One is for exporting coal. The other is for general goods. From 1907 to 1987, mining companies used a network of aerial tramways. These were like cable cars that carried coal from the mines to the port. The remains of these old cableways can still be seen today.
Images for kids
-
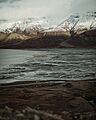
Longyearbyen outskirts
See also
 In Spanish: Longyearbyen para niños
