
Lynwood, Illinois facts for kids
Quick facts for kids
Lynwood, Illinois
|
||
|---|---|---|
|
||
| Motto(s):
"A progressive, growing community of families and friends"
|
||

Location of Lynwood in Cook County, Illinois.
|
||

Lynwood, Illinois
Location in Chicago metropolitan area

Lynwood, Illinois
Location in Illinois

Lynwood, Illinois
Location in the United States
|
||
| Country | United States | |
| State | Illinois | |
| County | Cook | |
| Township | Bloom | |
| Founded | 1959 | |
| Government | ||
| • Type | Village | |
| Area | ||
| • Total | 5.04 sq mi (13.05 km2) | |
| • Land | 4.96 sq mi (12.86 km2) | |
| • Water | 0.08 sq mi (0.20 km2) | |
| Population
(2020)
|
||
| • Total | 9,116 | |
| • Density | 1,836.42/sq mi (709.11/km2) | |
| Time zone | UTC−6 (CST) | |
| • Summer (DST) | UTC−5 (CDT) | |
| ZIP Code |
60411
|
|
| Area code(s) | 708 | |
| FIPS code | 17-45421 | |

Lynwood is a small village located in Cook County, Illinois, in the United States. It's a suburb of the big city of Chicago. In 2020, about 9,116 people lived there.
The village of Lynwood was started in 1959. It is surrounded by other towns. To the north is Lansing. To the west is Glenwood. To the south, you'll find Ford Heights and Sauk Village. On its eastern side are Munster and Dyer, Indiana, in the state of Indiana. The border with Indiana runs all along Lynwood's eastern edge. Today, Lynwood has a mix of homes and still a good amount of farmland.
Contents
Geography: Where Lynwood is Located
Lynwood is found at these coordinates: 41°31′35″N 87°32′53″W / 41.52639°N 87.54806°W. This helps us pinpoint its exact spot on a map.
The village covers a total area of about 5.04 square miles (13.05 square kilometers). Most of this area, about 4.96 square miles (12.86 square kilometers), is land. A smaller part, about 0.08 square miles (0.20 square kilometers), is water.
Neighboring Towns and Cities
Lynwood shares its borders with several other communities:
- To the north: Lansing
- To the west: Glenwood
- To the east: Munster and Dyer (these are in Indiana!)
- To the south: Ford Heights and Sauk Village
Population: How Lynwood Has Grown
| Historical population | |||
|---|---|---|---|
| Census | Pop. | %± | |
| 1960 | 255 | — | |
| 1970 | 1,042 | 308.6% | |
| 1980 | 4,195 | 302.6% | |
| 1990 | 6,535 | 55.8% | |
| 2000 | 7,377 | 12.9% | |
| 2010 | 9,007 | 22.1% | |
| 2020 | 9,116 | 1.2% | |
| U.S. Decennial Census 2010 2020 |
|||
In 2020, the village of Lynwood had 9,116 people living there. There were 3,052 households, which are like family units or groups of people living together. Out of these, 2,253 were families.
The population density was about 1,808 people per square mile. This means that for every square mile of land, there were about 1,808 people.
Who Lives in Lynwood?
The people living in Lynwood come from many different backgrounds.
- About 76% of the people were African American.
- About 14% were White.
- Smaller groups included Native American, Asian, and Pacific Islander people.
- About 5.5% of the population identified as being from two or more races.
- Around 8.25% of the people in Lynwood were of Hispanic or Latino background.
Many households in Lynwood have children. About 35.6% of households had kids under 18 living with them. The average household had about 3.63 people.
The median age in Lynwood was 38.4 years old. This means half the people were younger than 38.4 and half were older.
Transportation: Getting Around Lynwood
Pace is a public transportation service that helps people get around Lynwood. They offer bus service on Route 358. This route connects Lynwood to many other places in the Southland area.
Images for kids
-
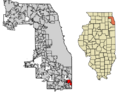
Location of Lynwood in Cook County, Illinois.
-
The official seal of Lynwood, Illinois.
See also
 In Spanish: Lynwood (Illinois) para niños
