Nibley, Utah facts for kids
Quick facts for kids
Nibley, Utah
|
||
|---|---|---|
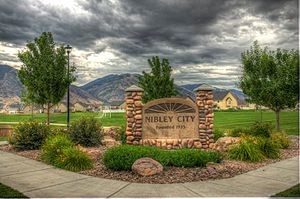
City sign on 800 W
|
||
|
||
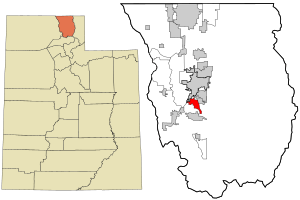
Location in Cache County and the state of Utah.
|
||
| Country | United States | |
| State | Utah | |
| County | Cache | |
| Settled | 1855 | |
| Incorporated | 1935 | |
| Named for | Charles W. Nibley | |
| Area | ||
| • Total | 4.39 sq mi (11.37 km2) | |
| • Land | 4.39 sq mi (11.37 km2) | |
| • Water | 0.00 sq mi (0.00 km2) | |
| Elevation | 4,551 ft (1,387 m) | |
| Population
(2020)
|
||
| • Total | 7,328 | |
| • Density | 1,669.2/sq mi (644.5/km2) | |
| Time zone | UTC-7 (Mountain (MST)) | |
| • Summer (DST) | UTC-6 (MDT) | |
| ZIP code |
84321
|
|
| Area code(s) | 435 | |
| FIPS code | 49-54660 | |
| GNIS feature ID | 2411253 | |
Nibley is a city located in Cache County, Utah, in the United States. It was officially made a city in 1935. The city was named after Charles W. Nibley, an important leader in the Church of Jesus Christ of Latter-day Saints. In 2020, about 7,328 people lived there. Nibley is part of the Logan, Utah-Idaho metropolitan area. It is often called a 'bedroom community' because many people who live in Nibley work in nearby Logan.
Nibley used to be mostly a farming area. However, it has grown a lot in recent years. Its population has more than doubled in less than ten years.
Contents
Nibley's Location and Size
Nibley is located in the beautiful Cache Valley. It sits between the cities of Hyrum and Logan.
The city covers a total area of about 4.03 square miles (10.4377 square kilometers). All of this area is land, with no large bodies of water.
Fun Community Events: Heritage Days
Nibley holds many events that bring its community closer. Each year, they have an Easter egg hunt and special holiday celebrations like a live nativity scene. The most famous celebration is called Heritage Days.
Heritage Days started in 1984. The mayor at the time, Mayor Leishman, wanted to create a special celebration for the city. He invited everyone who lived in Nibley, or used to live there, to join in the fun. They decided to hold it on a Saturday in June. It was such a big hit that they made it an annual event.
Today, Heritage Days happens every year during the week of the fourth Saturday in June. A parade is a big part of the celebration. It features Nibley residents, local businesses, and other groups. Other exciting events include a special dinner with the Mayor, a five-kilometer foot race, and a Children's Theater. There's also a petting zoo, a dunking machine, a bake-off, a beauty pageant, and a baby contest. These events offer lots of fun for families.
Nibley's Growing Population
| Historical population | |||
|---|---|---|---|
| Census | Pop. | %± | |
| 1940 | 271 | — | |
| 1950 | 304 | 12.2% | |
| 1960 | 333 | 9.5% | |
| 1970 | 367 | 10.2% | |
| 1980 | 1,036 | 182.3% | |
| 1990 | 1,167 | 12.6% | |
| 2000 | 2,045 | 75.2% | |
| 2010 | 5,438 | 165.9% | |
| 2020 | 7,328 | 34.8% | |
| U.S. Decennial Census | |||
In 2000, Nibley had 2,045 people living there. By 2010, the population had grown to 5,540 people. This shows that Nibley's population more than doubled in just ten years! By 2020, the population reached 7,328.
Most people in Nibley are White. In 2010, about 87.5% of the population was White. Other groups included American Indian, Asian, and Pacific Islander people. About 10.1% of the population identified as Hispanic or Latino.
Nibley is a city with many families. In 2010, over 60% of homes had children under 18 living there. Most households (87%) were married couples living together. The average household had about 3.75 people.
The population in Nibley is quite young. In 2010, almost half (45.7%) of the people were 19 years old or younger. The average age in the city was about 24.8 years old.
See also
 In Spanish: Nibley (Utah) para niños
 | Dorothy Vaughan |
 | Charles Henry Turner |
 | Hildrus Poindexter |
 | Henry Cecil McBay |


