Picton (ward) facts for kids
Quick facts for kids Picton |
|
|---|---|
 Picton ward (2004) within Liverpool |
|
| Area | 2.173 km2 (0.839 sq mi) |
| Population | 18,906 (2021 census) |
| • Density | 8,700/km2 (23,000/sq mi) |
| Registered Electors | 11,445 (2021 election) |
| Metropolitan borough | |
| Metropolitan county | |
| Region | |
| Country | England |
| Sovereign state | United Kingdom |
| EU Parliament | North West England |
| UK Parliament |
|
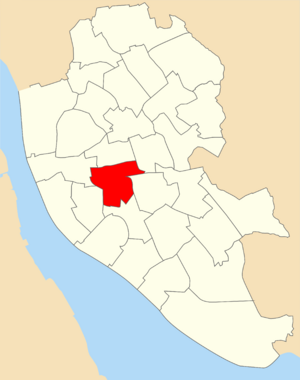
Picton ward was an area in Liverpool that had its own elected representatives on the Liverpool City Council. It was located around the Edge Hill, Liverpool district. Think of it like a neighborhood that gets to choose people to speak for it in the city government.
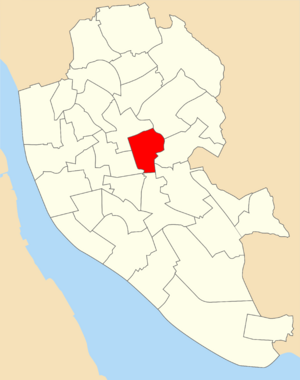
Picton ward was first created in 1953. Over the years, its borders changed a few times, in 1974, 1980, and 2004. It stopped being a separate ward in 2023.
Contents
How Picton Ward Changed Over Time
The boundaries of Picton ward were updated several times to make sure each ward had a fair number of people. These changes were decided by a group called the Local Government Boundary Commission for England.
The 1980 Changes
In 1980, the ward's borders were redrawn. This was part of a bigger plan to keep 99 councillors representing 33 wards in Liverpool. Picton ward was represented by three councillors at this time.
The 2004 Changes
Another big change happened in 2004. The number of councillors for Liverpool City Council was reduced to 90, spread across 30 wards. Picton ward's area changed again, taking in parts of other wards like Kensington and Smithdown.
The number of people living in Picton ward also changed over time. In 2011, about 17,009 people lived there. By 2021, this number grew to 18,906 people.
Who Represented Picton Ward?
People living in Picton ward elected councillors to represent them on the Liverpool City Council. These councillors worked to make decisions for the local community. Each ward usually had a few councillors.
For example, in the early 2000s, the Liberal Democrats party had councillors representing Picton ward. Later, from around 2010 onwards, the Labour Party won most of the elections and had councillors representing the ward.
How People Voted in Picton Ward
Elections are held so that people can choose who they want to represent them. In Picton ward, residents voted for their councillors. The results showed which political parties were popular in the area.
For example, in the 2021 election, Nathalie Nicholas from the Labour Party won with 1,697 votes. The Labour Party often won by a large number of votes in Picton ward. This meant they had strong support from the people living there.
Here are some examples of election results:
Elections in the 2020s
In the 2021 Liverpool City Council election, Nathalie Nicholas (Labour Party) won with 65.67% of the votes. The Green Party came in second.
| Liverpool City Council Municipal Elections: Thursday 6 May 2021 | |||||
|---|---|---|---|---|---|
| Party | Candidate | Votes | % | ±% | |
| Labour | Nathalie Nicholas | 1,697 | 65.67 | ||
| Green | Maria Teresa Coughlan | 443 | 17.14 | ||
| Liberal Democrats | Jenny Turner | 198 | 7.66 | ||
| Conservative | Joshua Forrester | 165 | 6.39 | ||
| Liberal | Alan Oscroft | 81 | 3.13% | ||
| Majority | 1,254 | 48.53 | |||
| Turnout | 2,584 | 22.58 | |||
| Rejected ballots | 63 | 2.38 | |||
| Total ballots | 2,647 | 23.13 | |||
| Registered electors | 11,445 | ||||
| Labour hold | Swing | -11.97 | |||
Elections in the 2010s
In 2019, there was a special by-election in Picton. Calvin Wesley Smeda (Labour Party) won with a very high percentage of the votes.
| Picton by-election 2019 | |||||
|---|---|---|---|---|---|
| Party | Candidate | Votes | % | ±% | |
| Labour | Calvin Wesley Smeda | 5,196 | 79.45 | ||
| Green | Sophie Brown | 457 | 6.99 | ||
| Conservative | Chris Hall | 362 | 5.54 | ||
| Liberal Democrats | Jenny Turner | 336 | 5.14 | ||
| Liberal | Alan Oscroft | 108 | 1.65 | ||
| Independent | Adam Heatherington | 81 | 1.24 | ||
| Majority | 4,739 | 72.46 | |||
| Turnout | 6,540 | 56.69 | |||
| Rejected ballots | 39 | 0.59 | |||
| Total ballots | 6,579 | 57.03 | |||
| Registered electors | 11,536 | ||||
| Labour hold | Swing | +8.92 | |||
In the 2019 Liverpool City Council election, Abdul Qadir (Labour Party) was the winning candidate.
| Liverpool City Council Municipal Elections: Thursday 2 May 2019 | |||||
|---|---|---|---|---|---|
| Party | Candidate | Votes | % | ±% | |
| Labour | Abdul Qadir | 1,556 | 69.84 | ||
| Green | Sophie Brown | 339 | 15.22 | ||
| Liberal Democrats | Steve Brauner | 167 | 7.50 | ||
| Conservative | Joshua Forrester | 96 | 4.31 | ||
| Liberal | Alan Oscroft | 70 | 3.14 | ||
| Majority | 1,217 | 54.62 | |||
| Turnout | 2,250 | 22.37 | |||
| Registered electors | 10,059 | ||||
| Rejected ballots | 22 | 0.98 | |||
| Labour hold | Swing | -11.47 | |||


