
Richland, Oregon facts for kids
Quick facts for kids
Richland, Oregon
|
|
|---|---|

Main Street
|
|

Location in Oregon
|
|
| Country | United States |
| State | Oregon |
| County | Baker |
| Incorporated | 1917 |
| Area | |
| • Total | 0.10 sq mi (0.27 km2) |
| • Land | 0.10 sq mi (0.27 km2) |
| • Water | 0.00 sq mi (0.00 km2) |
| Elevation | 2,211 ft (674 m) |
| Population
(2020)
|
|
| • Total | 165 |
| • Density | 1,571.43/sq mi (603.89/km2) |
| Time zone | UTC-8 (Pacific) |
| • Summer (DST) | UTC-7 (Pacific) |
| ZIP code |
97870
|
| Area code(s) | 541 |
| FIPS code | 41-61700 |
| GNIS feature ID | 2410936 |
Richland is a small city located in Baker County, Oregon, in the United States. In 2020, about 165 people lived there.
Contents
A Look Back: Richland's History
Richland was officially planned and mapped out in 1897. It took over from a nearby place called New Bridge. Richland became the main center for services in the countryside.
Exploring Richland's Geography
Richland is located along Oregon Route 86. This road connects it to Baker City and Oxbow. Oxbow is very close to the border between Oregon and Idaho.
Land Area
The United States Census Bureau says Richland is quite small. The city covers a total area of about 0.10 square miles (0.27 square kilometers). All of this area is land.
Richland's Climate
Richland has a special type of weather called a "dry, hot summer humid continental climate". On climate maps, this is shown as "Dsa". This means it has hot, dry summers and cold winters.
| Climate data for Richland | |||||||||||||
|---|---|---|---|---|---|---|---|---|---|---|---|---|---|
| Month | Jan | Feb | Mar | Apr | May | Jun | Jul | Aug | Sep | Oct | Nov | Dec | Year |
| Record high °F (°C) | 62 (17) |
76 (24) |
85 (29) |
92 (33) |
98 (37) |
105 (41) |
111 (44) |
109 (43) |
105 (41) |
92 (33) |
78 (26) |
65 (18) |
111 (44) |
| Mean daily maximum °F (°C) | 38.1 (3.4) |
45.7 (7.6) |
55.2 (12.9) |
65.4 (18.6) |
74.1 (23.4) |
82.4 (28.0) |
92.3 (33.5) |
91.2 (32.9) |
81.4 (27.4) |
68 (20) |
50.7 (10.4) |
40.4 (4.7) |
65.4 (18.6) |
| Mean daily minimum °F (°C) | 19.7 (−6.8) |
24.5 (−4.2) |
28.8 (−1.8) |
33.5 (0.8) |
40.6 (4.8) |
47.1 (8.4) |
52.8 (11.6) |
50.7 (10.4) |
42 (6) |
33.1 (0.6) |
26.6 (−3.0) |
21.9 (−5.6) |
35.1 (1.7) |
| Record low °F (°C) | −27 (−33) |
−26 (−32) |
−9 (−23) |
13 (−11) |
12 (−11) |
19 (−7) |
25 (−4) |
31 (−1) |
18 (−8) |
6 (−14) |
−7 (−22) |
−22 (−30) |
−27 (−33) |
| Average precipitation inches (mm) | 1.27 (32) |
0.85 (22) |
0.81 (21) |
0.9 (23) |
1.33 (34) |
1.03 (26) |
0.39 (9.9) |
0.54 (14) |
0.54 (14) |
0.72 (18) |
1.27 (32) |
1.3 (33) |
10.95 (278) |
| Average snowfall inches (cm) | 6.4 (16) |
2.7 (6.9) |
0.7 (1.8) |
0.2 (0.51) |
0 (0) |
0 (0) |
0 (0) |
0 (0) |
0 (0) |
0.1 (0.25) |
2.1 (5.3) |
5.1 (13) |
17.4 (44) |
| Average precipitation days | 7 | 5 | 5 | 5 | 6 | 5 | 2 | 3 | 3 | 5 | 7 | 7 | 60 |
People of Richland: Demographics
| Historical population | |||
|---|---|---|---|
| Census | Pop. | %± | |
| 1910 | 334 | — | |
| 1920 | 244 | −26.9% | |
| 1930 | 212 | −13.1% | |
| 1940 | 254 | 19.8% | |
| 1950 | 220 | −13.4% | |
| 1960 | 228 | 3.6% | |
| 1970 | 133 | −41.7% | |
| 1980 | 181 | 36.1% | |
| 1990 | 161 | −11.0% | |
| 2000 | 147 | −8.7% | |
| 2010 | 156 | 6.1% | |
| 2020 | 165 | 5.8% | |
| U.S. Decennial Census | |||
What the 2010 Census Showed
In 2010, the census counted 156 people living in Richland. There were 93 households and 46 families. The city had about 1,950 people per square mile. There were 116 homes, with about 1,450 homes per square mile.
Most of the people (94.9%) were White. A small number were African American (1.3%) or Native American (1.3%). About 2.6% of people were from two or more racial backgrounds. No one reported being Asian or Hispanic or Latino.
Out of 93 households, only a few (2.2%) had children under 18. Almost half (48.4%) were married couples. About 50.5% of households were not families. Many people (38.7%) lived alone. About 23.6% of these were people aged 65 or older. The average household had 1.68 people, and the average family had 2.11 people.
The average age in Richland was 64.4 years old. Only 1.9% of residents were under 18. About 2.4% were between 18 and 24. A larger group (40.4%) was between 45 and 64. The largest group (48.1%) was 65 years or older. The city had slightly more males (50.6%) than females (49.4%).
Images for kids
-
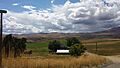
Big Lookout Mountain Range outside the city of Richland
-
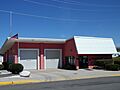
Richland city hall-fire station
-
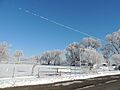
Eagle Valley Community Park in Richland


See also
 In Spanish: Richland (Oregón) para niños
