Rosalia, Washington facts for kids
Quick facts for kids
Rosalia
|
|
|---|---|
| Rosalia, Washington | |

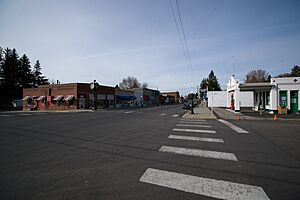
Central Rosalia
|
|

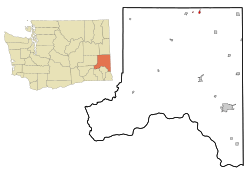
Location of Rosalia, Washington
|
|
| Country | United States |
| State | Washington |
| County | Whitman |
| Area | |
| • Total | 0.63 sq mi (1.63 km2) |
| • Land | 0.63 sq mi (1.63 km2) |
| • Water | 0.00 sq mi (0.00 km2) |
| Elevation | 2,238 ft (682 m) |
| Population
(2020)
|
|
| • Total | 598 |
| • Density | 949/sq mi (366.9/km2) |
| Time zone | UTC-8 (Pacific (PST)) |
| • Summer (DST) | UTC-7 (PDT) |
| ZIP code |
99170
|
| Area code | 509 |
| FIPS code | 53-59775 |
| GNIS feature ID | 1507912 |
| Website | Town of Rosalia |
Rosalia is a small town in Whitman County, Washington, United States. It is a farming community located in the beautiful Palouse region. The town sits about 2,238 feet (682 meters) above sea level. In 2020, about 598 people lived there.
Contents
History of Rosalia
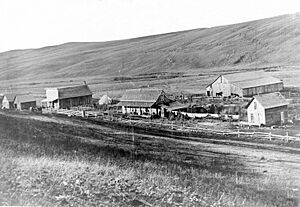
Rosalia is a place with an interesting past. In 1858, a battle called the Battle of Pine Creek happened here. It was fought between United States troops and Native American tribes. These tribes included the Coeur d'Alene, Palus, and Spokane people.
The town of Rosalia was started in 1870 by a man named T.J. Favorite. He decided to name the town after his wife. Rosalia officially became a town on March 23, 1894.
Geography and Climate
Rosalia is located in eastern Washington state. The United States Census Bureau says the town covers about 0.62 square miles (1.63 square kilometers) of land. There is no water area within the town limits.
Rosalia's Climate
Rosalia has a type of weather called a dry-summer humid continental climate. This means it has warm, dry summers and cold winters.
| Climate data for Rosalia, Washington (1991–2020 normals, extremes 1893–present) | |||||||||||||
|---|---|---|---|---|---|---|---|---|---|---|---|---|---|
| Month | Jan | Feb | Mar | Apr | May | Jun | Jul | Aug | Sep | Oct | Nov | Dec | Year |
| Record high °F (°C) | 60 (16) |
66 (19) |
74 (23) |
94 (34) |
98 (37) |
107 (42) |
111 (44) |
108 (42) |
105 (41) |
90 (32) |
72 (22) |
64 (18) |
111 (44) |
| Mean daily maximum °F (°C) | 36.7 (2.6) |
41.5 (5.3) |
49.6 (9.8) |
58.0 (14.4) |
67.2 (19.6) |
73.4 (23.0) |
85.0 (29.4) |
85.7 (29.8) |
75.7 (24.3) |
60.6 (15.9) |
45.1 (7.3) |
36.1 (2.3) |
59.6 (15.3) |
| Daily mean °F (°C) | 30.6 (−0.8) |
33.9 (1.1) |
40.1 (4.5) |
46.4 (8.0) |
54.6 (12.6) |
60.2 (15.7) |
68.2 (20.1) |
68.3 (20.2) |
59.8 (15.4) |
47.9 (8.8) |
37.2 (2.9) |
30.3 (−0.9) |
48.1 (8.9) |
| Mean daily minimum °F (°C) | 24.5 (−4.2) |
26.3 (−3.2) |
30.6 (−0.8) |
34.8 (1.6) |
41.9 (5.5) |
46.9 (8.3) |
51.4 (10.8) |
50.9 (10.5) |
43.9 (6.6) |
35.2 (1.8) |
29.3 (−1.5) |
24.4 (−4.2) |
36.7 (2.6) |
| Record low °F (°C) | −26 (−32) |
−25 (−32) |
−4 (−20) |
10 (−12) |
22 (−6) |
27 (−3) |
29 (−2) |
31 (−1) |
11 (−12) |
3 (−16) |
−15 (−26) |
−29 (−34) |
−29 (−34) |
| Average precipitation inches (mm) | 2.03 (52) |
1.72 (44) |
1.90 (48) |
1.55 (39) |
1.66 (42) |
1.33 (34) |
0.52 (13) |
0.42 (11) |
0.62 (16) |
1.53 (39) |
2.46 (62) |
2.66 (68) |
18.40 (467) |
| Average snowfall inches (cm) | 6.4 (16) |
3.2 (8.1) |
1.6 (4.1) |
0.2 (0.51) |
0.0 (0.0) |
0.0 (0.0) |
0.0 (0.0) |
0.0 (0.0) |
0.0 (0.0) |
0.1 (0.25) |
3.9 (9.9) |
10.8 (27) |
26.2 (67) |
| Average precipitation days (≥ 0.01 in) | 11.9 | 9.4 | 11.0 | 10.1 | 8.7 | 8.2 | 3.6 | 3.4 | 4.2 | 8.3 | 12.9 | 12.4 | 104.1 |
| Average snowy days (≥ 0.1 in) | 4.3 | 2.2 | 1.4 | 0.2 | 0.0 | 0.0 | 0.0 | 0.0 | 0.0 | 0.0 | 2.1 | 5.4 | 15.6 |
| Source: NOAA | |||||||||||||
Population and People
| Historical population | |||
|---|---|---|---|
| Census | Pop. | %± | |
| 1890 | 248 | — | |
| 1900 | 379 | 52.8% | |
| 1910 | 767 | 102.4% | |
| 1920 | 714 | −6.9% | |
| 1930 | 633 | −11.3% | |
| 1940 | 596 | −5.8% | |
| 1950 | 660 | 10.7% | |
| 1960 | 585 | −11.4% | |
| 1970 | 569 | −2.7% | |
| 1980 | 572 | 0.5% | |
| 1990 | 552 | −3.5% | |
| 2000 | 648 | 17.4% | |
| 2010 | 550 | −15.1% | |
| 2020 | 598 | 8.7% | |
| U.S. Decennial Census | |||
The population of Rosalia has changed over the years. You can see how many people lived there in different census years in the chart above.
Rosalia's Population in 2010
In 2010, there were 550 people living in Rosalia. These people lived in 228 homes, and 151 of these were families. The town had about 887 people per square mile (342 people per square kilometer).
Most of the people in Rosalia were White (96.5%). A small number were African American, Native American, or Asian. About 4.2% of the population was Hispanic or Latino.
About 28.5% of homes had children under 18 living there. Many homes (49.6%) were married couples. The average home had 2.41 people, and the average family had 2.89 people. The average age of people in Rosalia was 43.4 years old.
Education in Rosalia
The Rosalia School District was recognized with a "Best School National Award" in 2006. This shows their commitment to education.
Rosalia in Movies
Rosalia and the surrounding Palouse region have been used as filming locations for movies.
- Outdoor scenes for the 1992 film Toys were filmed near Rosalia.
- Scenes from the 1999 drama The Basket were also filmed in and around the town.
See also
 In Spanish: Rosalia (Washington) para niños
 | John T. Biggers |
 | Thomas Blackshear |
 | Mark Bradford |
 | Beverly Buchanan |


