
Sedgwick, Colorado facts for kids
Quick facts for kids
Sedgwick, Colorado
|
|
|---|---|

Community signs (2017)
|
|

Location within Sedgwick County and Colorado
|
|
| Country | United States |
| State | Colorado |
| County | Sedgwick County |
| Incorporated | January 28, 1918 |
| Area | |
| • Total | 0.35 sq mi (0.90 km2) |
| • Land | 0.35 sq mi (0.90 km2) |
| • Water | 0.00 sq mi (0.00 km2) |
| Elevation | 3,586 ft (1,093 m) |
| Population
(2020)
|
|
| • Total | 172 |
| • Density | 491/sq mi (191.1/km2) |
| Time zone | UTC−7 (MST) |
| • Summer (DST) | UTC−6 (MDT) |
| ZIP Code |
80749ZIP code
|
| Area code | 970 |
| FIPS code | 08-68930 |
| GNIS ID | 182694 |
Sedgwick is a small town located in Sedgwick County, Colorado, United States. In 2020, about 172 people lived there. A "statutory town" means it follows general laws set by the state of Colorado for how towns are run.
Contents
History of Sedgwick
Sedgwick got its name from Fort Sedgwick. This fort was named after John Sedgwick. He was a very important general in the Union Army. This was during the American Civil War.
Where is Sedgwick Located?
Sedgwick is in northeastern Colorado. It is located at about 40.9 degrees North and 102.5 degrees West. The town covers a total area of about 0.3 square miles (0.9 square kilometers). All of this area is land.
What is the Climate Like in Sedgwick?
Sedgwick has a semi-arid climate. This means it is usually dry, but not a desert. It gets some rain, but not a lot. The climate is often called "BSk" on climate maps.
One of the hottest times in Sedgwick was July 1954. During that month, temperatures reached 100°F (38°C) or higher for 16 days. On July 11, 1954, the temperature even went up to 114°F (46°C)!
| Climate data for Sedgwick, Colorado, 1991–2020 normals, extremes 1952–present | |||||||||||||
|---|---|---|---|---|---|---|---|---|---|---|---|---|---|
| Month | Jan | Feb | Mar | Apr | May | Jun | Jul | Aug | Sep | Oct | Nov | Dec | Year |
| Record high °F (°C) | 73 (23) |
77 (25) |
86 (30) |
94 (34) |
100 (38) |
110 (43) |
114 (46) |
106 (41) |
103 (39) |
94 (34) |
81 (27) |
76 (24) |
114 (46) |
| Mean maximum °F (°C) | 62.0 (16.7) |
66.5 (19.2) |
77.2 (25.1) |
83.4 (28.6) |
90.6 (32.6) |
98.1 (36.7) |
102.7 (39.3) |
99.5 (37.5) |
96.3 (35.7) |
86.9 (30.5) |
73.9 (23.3) |
62.5 (16.9) |
103.6 (39.8) |
| Mean daily maximum °F (°C) | 39.5 (4.2) |
42.3 (5.7) |
53.3 (11.8) |
60.7 (15.9) |
70.1 (21.2) |
82.6 (28.1) |
89.7 (32.1) |
87.2 (30.7) |
79.3 (26.3) |
64.0 (17.8) |
50.4 (10.2) |
39.9 (4.4) |
63.2 (17.4) |
| Daily mean °F (°C) | 27.4 (−2.6) |
29.8 (−1.2) |
39.3 (4.1) |
46.8 (8.2) |
56.9 (13.8) |
68.5 (20.3) |
75.0 (23.9) |
72.6 (22.6) |
64.1 (17.8) |
49.7 (9.8) |
37.4 (3.0) |
27.9 (−2.3) |
49.6 (9.8) |
| Mean daily minimum °F (°C) | 15.2 (−9.3) |
17.3 (−8.2) |
25.3 (−3.7) |
33.0 (0.6) |
43.8 (6.6) |
54.4 (12.4) |
60.3 (15.7) |
57.9 (14.4) |
48.8 (9.3) |
35.5 (1.9) |
24.3 (−4.3) |
16.0 (−8.9) |
36.0 (2.2) |
| Mean minimum °F (°C) | −5.7 (−20.9) |
−1.9 (−18.8) |
7.5 (−13.6) |
18.6 (−7.4) |
29.5 (−1.4) |
43.3 (6.3) |
51.8 (11.0) |
48.5 (9.2) |
35.3 (1.8) |
18.2 (−7.7) |
6.5 (−14.2) |
−3.1 (−19.5) |
−11.7 (−24.3) |
| Record low °F (°C) | −26 (−32) |
−26 (−32) |
−16 (−27) |
6 (−14) |
21 (−6) |
33 (1) |
42 (6) |
40 (4) |
17 (−8) |
−2 (−19) |
−9 (−23) |
−30 (−34) |
−30 (−34) |
| Average precipitation inches (mm) | 0.32 (8.1) |
0.49 (12) |
0.90 (23) |
2.03 (52) |
2.92 (74) |
3.15 (80) |
2.16 (55) |
2.08 (53) |
1.35 (34) |
1.32 (34) |
0.52 (13) |
0.37 (9.4) |
17.61 (447.5) |
| Average snowfall inches (cm) | 4.1 (10) |
6.1 (15) |
5.1 (13) |
4.6 (12) |
0.4 (1.0) |
0.0 (0.0) |
0.0 (0.0) |
0.0 (0.0) |
0.2 (0.51) |
2.5 (6.4) |
3.6 (9.1) |
4.8 (12) |
31.4 (79.01) |
| Average precipitation days (≥ 0.01 in) | 2.6 | 4.1 | 5.0 | 7.2 | 9.1 | 8.7 | 7.4 | 6.8 | 5.2 | 5.6 | 3.4 | 2.9 | 68.0 |
| Average snowy days (≥ 0.1 in) | 2.3 | 3.4 | 2.5 | 1.8 | 0.2 | 0.0 | 0.0 | 0.0 | 0.1 | 1.0 | 1.8 | 2.6 | 15.7 |
| Source 1: NOAA | |||||||||||||
| Source 2: National Weather Service | |||||||||||||
How Many People Live in Sedgwick?
The number of people living in Sedgwick has changed over the years. Here's how the population has looked:
| Historical population | |||
|---|---|---|---|
| Census | Pop. | %± | |
| 1920 | 380 | — | |
| 1930 | 444 | 16.8% | |
| 1940 | 373 | −16.0% | |
| 1950 | 332 | −11.0% | |
| 1960 | 299 | −9.9% | |
| 1970 | 208 | −30.4% | |
| 1980 | 258 | 24.0% | |
| 1990 | 183 | −29.1% | |
| 2000 | 191 | 4.4% | |
| 2010 | 146 | −23.6% | |
| 2020 | 172 | 17.8% | |
Images for kids
-
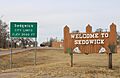
Community signs (2017)
-
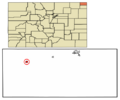
Location within Sedgwick County and Colorado
See also
 In Spanish: Sedgwick (Colorado) para niños
