South San Jose Hills, California facts for kids
Quick facts for kids
South San Jose Hills, California
|
|
|---|---|

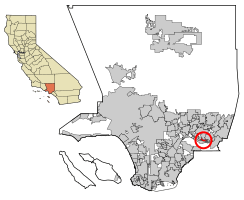
Location of South San Jose Hills in Los Angeles County, California.
|
|
| Country | |
| State | |
| County | |
| Area | |
| • Total | 1.508 sq mi (3.905 km2) |
| • Land | 1.508 sq mi (3.905 km2) |
| • Water | 0 sq mi (0 km2) 0% |
| Elevation | 417 ft (127 m) |
| Population
(2020)
|
|
| • Total | 19,855 |
| • Density | 13,166/sq mi (5,084.5/km2) |
| Time zone | UTC-8 (PST) |
| • Summer (DST) | UTC-7 (PDT) |
| ZIP code |
91744
|
| Area code(s) | 626 |
| FIPS code | 06-73290 |
| GNIS feature ID | 1867058 |
South San Jose Hills is a community in Los Angeles County, California, United States. It is called a "census-designated place" because the government collects information about the people living there. In 2020, about 19,855 people lived in South San Jose Hills.
Contents
Geography of South San Jose Hills
South San Jose Hills is a residential area. It is located on the southern part of the San Jose Hills. These hills are part of the larger San Gabriel Valley.
The community is surrounded by several cities. To the south is the City of Industry. La Puente is to the west, and West Covina is to the north. To the east, you will find Walnut.
Getting around is easy because the Pomona Freeway (State Route 60) runs just south of the community. The ZIP code for the area is 91744. Many addresses in South San Jose Hills use the city names La Puente, West Covina, or Valinda instead of South San Jose Hills.
Population and Demographics
Demographics is the study of a population. It looks at things like how many people live somewhere, their ages, and their backgrounds.
| Historical population | |||
|---|---|---|---|
| Census | Pop. | %± | |
| 1970 | 12,386 | — | |
| 1980 | 16,049 | 29.6% | |
| 1990 | 17,814 | 11.0% | |
| 2000 | 20,218 | 13.5% | |
| 2010 | 20,551 | 1.6% | |
Population in 2010
In 2010, South San Jose Hills had a population of 20,551 people. This means there were about 13,629 people per square mile. Most people (99.9%) lived in homes with their families or roommates.
The population was diverse. About 45.3% of people were White, and 8.0% were Asian. A large number, 86.2%, identified as Hispanic or Latino.
Many households had children under 18. The average household had about five people living together. The median age in the community was about 29.7 years old. This means half the people were younger and half were older than 29.7.
Most homes (76.1%) were owned by the people living in them. The rest were rented. The median household income in 2010 was $50,864. About 16.2% of the population lived below the poverty line.
Population in 2000
In 2000, the population was 20,218 people. The population density was about 13,876 people per square mile.
The racial makeup was also diverse. About 38.76% of people were White, and 6.54% were Asian. A large majority, 83.43%, were Hispanic or Latino.
Many households (53.2%) had children under 18. The average household size was 5.07 people. The median age was 27 years.
The median household income in 2000 was $48,655. About 18.5% of the population lived below the poverty line.
Education
Students in South San Jose Hills attend schools within the Rowland Unified School District.
See also
 In Spanish: South San Jose Hills para niños
 | Claudette Colvin |
 | Myrlie Evers-Williams |
 | Alberta Odell Jones |


