
Live Oak, Sutter County, California facts for kids
Quick facts for kids
City of Live Oak
|
|
|---|---|

Live Oak, California. On Live Oak blvd and Pennington Road access to Leo Cheney Correctional Center.
|
|

Location of Live Oak in Sutter County, California.
|
|

Live Oak, Sutter County, California
Location in the United States
|
|
| Country | |
| State | |
| County | Sutter |
| Incorporated | January 22, 1947 |
| Government | |
| • Type | Council-Manager |
| Area | |
| • Total | 3.12 sq mi (8.08 km2) |
| • Land | 3.12 sq mi (8.08 km2) |
| • Water | 0.00 sq mi (0.00 km2) 0% |
| Elevation | 79 ft (24 m) |
| Population
(2020)
|
|
| • Total | 9,106 |
| • Density | 2,855.50/sq mi (1,102.52/km2) |
| Time zone | UTC-8 (Pacific (PST)) |
| • Summer (DST) | UTC-7 (PDT) |
| ZIP codes |
95953
|
| Area code(s) | 530 |
| FIPS code | 06-41936 |
| GNIS feature IDs | 277541, 2410846 |
Live Oak is a city in Sutter County, California, United States. It is part of the Yuba City Metropolitan Statistical Area. This area is also part of the larger Greater Sacramento region. Live Oak also includes a small area historically known as Stafford.
The city was officially created on January 22, 1947. In 2020, about 9,106 people lived in Live Oak. This was an increase from 8,392 people in 2010.
Contents
Live Oak's Location and Surroundings

Live Oak is located in a fertile area called the Sacramento Valley. The city's exact coordinates are 39.274518 degrees North and 121.662003 degrees West.
The city covers about 2.5 square miles (6.5 square kilometers) of land. There is no water within the city limits. Live Oak is surrounded by rich farmlands and orchards. The Feather River and the unique Sutter Buttes mountains are also nearby.
Live Oak's Weather and Climate
Live Oak has a Mediterranean climate. This means it has hot, dry summers and long, cool, wet winters.
Summer Weather in Live Oak
Summers are usually hot, sunny, and dry. Sometimes, a "delta breeze" blows in, which can cool things down a bit. Heat waves are common in summer, usually lasting for 3 to 5 days. Temperatures can reach between 105 and 110 degrees Fahrenheit (40-43 Celsius). It rarely rains from mid-May to mid-September. July is the hottest month, with average temperatures around 96 to 100 degrees Fahrenheit (35-38 Celsius).
Winter Weather in Live Oak
Winters are long, wet, cool, and often foggy. The rainy season lasts from mid-October to mid-April. January is the wettest and coolest month, with about 4 to 6 inches (10-15 cm) of rain. During El Niño years, there can be much more rain, sometimes causing floods. During La Niña years, there is less rain, which can lead to droughts in the summer.
Winter temperatures average around 45 to 50 degrees Fahrenheit (7-10 Celsius). Foggy and cloudy weather, known as Tule fog, can last for several weeks. Snow is very rare in Live Oak. The most snow ever recorded was 3.8 inches (9.7 cm) in 2002.
| Month | High (°F) | Low (°F) | Precip. (inches) |
|---|---|---|---|
| January | 54 | 35 | 4.97 |
| February | 59 | 39 | 4.34 |
| March | 65 | 41 | 3.78 |
| April | 74 | 45 | 1.78 |
| May | 85 | 50 | 0.89 |
| June | 94 | 56 | 0.21 |
| July | 95 | 61 | 0.08 |
| August | 94 | 61 | 0.09 |
| September | 87 | 56 | 0.51 |
| October | 76 | 47 | 1.56 |
| November | 60 | 41 | 3.67 |
| December | 55 | 38 | 3.89 |
Live Oak's Population Growth
| Historical population | |||
|---|---|---|---|
| Census | Pop. | %± | |
| 1950 | 1,770 | — | |
| 1960 | 2,276 | 28.6% | |
| 1970 | 2,645 | 16.2% | |
| 1980 | 3,103 | 17.3% | |
| 1990 | 4,320 | 39.2% | |
| 2000 | 6,229 | 44.2% | |
| 2010 | 8,392 | 34.7% | |
| 2020 | 9,106 | 8.5% | |
| U.S. Decennial Census | |||
Live Oak has grown quite a bit over the years. In 1950, there were only 1,770 people living there. By 2020, the population had increased to 9,106 people. This shows that more and more people have chosen to make Live Oak their home.
Education in Live Oak
Live Oak has several schools and child care centers for students of all ages:
- Live Oak Child Care Center (ages 3–5)
- Live Oak Headstart Preschool
- Live Oak Luther Elementary School (kindergarten-5th grade)
- Live Oak Middle School (6th–8th grades)
- Live Oak High School (9th–12th grades)
- Encinal Elementary School (kindergarten-8th grade)
- Nuestro Elementary School (kindergarten-8th grade)
Emergency Services in Live Oak
Live Oak has important services to keep its residents safe.
Fire Department
The city has its own fire department. It is part of the larger Sutter County Fire Department.
Law Enforcement
Live Oak used to have its own police department. Since the mid-1970s, the city has worked with the Sutter County Sheriff's Department. This means that deputies from the Sheriff's Department are specifically assigned to patrol the Live Oak area.
There is a special substation in Live Oak. It has seven patrol deputies, a Sergeant, and a Lieutenant. The city also has a K9 unit (a police dog and its handler) that works only in the Live Oak area.
Emergency Medical Services (EMS)
When someone needs urgent medical help, EMS are provided by the Bi-County Ambulance company. This company serves both Sutter and Yuba counties. They provide ambulance and paramedics services.
Emergency Services Headquarters
Both the Sheriff's Department Live Oak Sub Station and the Live Oak Fire Department are located at the corner of Fir Street and O Street in Live Oak.
Business and Economy
The economy of Live Oak mostly depends on farming. The rich farmlands around the city produce many crops.
There is also a facility called the Leo Chesney prison. It is located near residential areas. This facility used to house people but has been empty since 2011. It is owned by a company called CoreCivic.

Images for kids
-
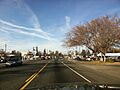
Live Oak, California. On Live Oak blvd and Pennington Road access to Leo Cheney Correctional Center.
See also
 In Spanish: Live Oak (condado de Sutter) para niños
