Tullytown, Pennsylvania facts for kids
Quick facts for kids
Tullytown, Pennsylvania
|
|
|---|---|
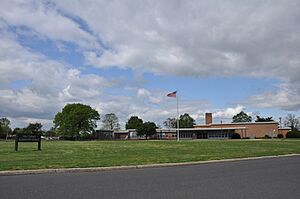
Walt Disney Elementary School
|
|
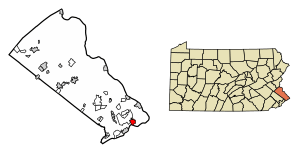
Location in Bucks County, Pennsylvania
|
|
| Country | United States |
| State | Pennsylvania |
| County | Bucks |
| Area | |
| • Total | 2.11 sq mi (5.46 km2) |
| • Land | 1.52 sq mi (3.93 km2) |
| • Water | 0.59 sq mi (1.53 km2) |
| Elevation | 20 ft (6 m) |
| Population
(2010)
|
|
| • Total | 1,872 |
| • Estimate
(2019)
|
2,181 |
| • Density | 1,436.76/sq mi (554.62/km2) |
| Time zone | UTC-5 (EST) |
| • Summer (DST) | UTC-4 (EDT) |
| ZIP Code |
19007
|
| Area code(s) | 215, 267 and 445 |
| FIPS code | 42-77744 |
Tullytown is a small town, called a borough, located in Bucks County, Pennsylvania. It used to be a village within Falls Township. In 1891, Tullytown became its own borough.
According to the 2010 United States Census, about 1,872 people lived there. A part of the larger community of Levittown is also found within Tullytown.
Contents
History of Tullytown
The Walt Disney Elementary School is an important building in Tullytown. It was added to the National Register of Historic Places in 2007. This means it is a special place recognized for its historical value.
Geography and Location
Tullytown is located at coordinates 40.145077 degrees North and -74.817841 degrees West. This helps pinpoint its exact spot on a map.
Waterways in Tullytown
A small stream called Wickus Sippus Creek flows through the borough.
Size of Tullytown
The United States Census Bureau says that Tullytown covers a total area of about 2.1 square miles (5.4 square kilometers). Most of this area, about 1.6 square miles (3.9 square kilometers), is land. The remaining 0.5 square miles (1.5 square kilometers), which is about 24.88% of its total area, is water.
People and Population
Tullytown has seen its population change over the years. Here's how many people have lived there at different times:
| Historical population | |||
|---|---|---|---|
| Census | Pop. | %± | |
| 1880 | 262 | — | |
| 1900 | 528 | — | |
| 1910 | 622 | 17.8% | |
| 1920 | 572 | −8.0% | |
| 1930 | 658 | 15.0% | |
| 1940 | 562 | −14.6% | |
| 1950 | 648 | 15.3% | |
| 1960 | 2,452 | 278.4% | |
| 1970 | 2,194 | −10.5% | |
| 1980 | 2,277 | 3.8% | |
| 1990 | 2,339 | 2.7% | |
| 2000 | 2,031 | −13.2% | |
| 2010 | 1,872 | −7.8% | |
| 2020 | 2,282 | 21.9% | |
| Sources: | |||
Population Makeup
In 2010, most of the people living in Tullytown were White (92.5%). About 3.2% were Black or African American. Smaller groups included Native American (0.2%) and Asian (0.4%). About 1.1% of residents identified as two or more races. People of Hispanic or Latino background made up 3.0% of the population.
Households and Families
In 2000, there were 2,031 people living in 803 households. About 501 of these were families. The average number of people in a household was 2.52, and the average family had 3.24 people.
About 29.0% of households had children under 18 living with them. Many households (46.7%) were married couples. About 10.3% were female-led households without a husband present. Also, 37.5% of households were not families.
Age Distribution
The population in Tullytown is spread out by age. In 2000, 24.5% of residents were under 18 years old. About 7.9% were between 18 and 24. The largest group, 30.3%, was between 25 and 44 years old. People aged 45 to 64 made up 20.4%, and 16.9% were 65 or older. The average age was 39 years.
Income Levels
In 2000, the average income for a household in Tullytown was $45,625. For families, the average income was $57,917. Men earned about $35,774 on average, while women earned about $28,352. The average income per person in the borough was $22,206. A small number of families (1.6%) and individuals (4.2%) lived below the poverty line.
Climate and Weather
Tullytown has a humid subtropical climate (Cfa). This means it has hot, humid summers and mild to cool winters. All months have an average temperature above 32°F (0°C). At least four months average above 50°F (10°C), and at least one month averages above 71.6°F (22°C). There isn't a big difference in rainfall between seasons.
Temperature Extremes
Even though most summer days are a bit humid, sometimes it can get very hot and sticky. The highest temperature ever recorded since 1981 was 103.2°F (39.6°C) on July 6, 2010. The coldest temperature recorded was -9.6°F (-23.1°C) on January 22, 1984.
Rainfall and Snowfall
July is usually the wettest month, which is when thunderstorms are most common. The most rain in one day was 6.35 inches (161 mm) on August 27, 2011. Tullytown gets about 24 to 30 inches (61 to 76 cm) of snow each year, mostly from November to April. Big snowstorms with more than 12 inches (30 cm) of snow happen every few years.
| Climate data for Tullytown, Elevation 16 ft (5 m), 1981-2010 normals, extremes 1981-2018 | |||||||||||||
|---|---|---|---|---|---|---|---|---|---|---|---|---|---|
| Month | Jan | Feb | Mar | Apr | May | Jun | Jul | Aug | Sep | Oct | Nov | Dec | Year |
| Record high °F (°C) | 71.8 (22.1) |
77.9 (25.5) |
87.8 (31.0) |
95.1 (35.1) |
96.0 (35.6) |
97.3 (36.3) |
103.2 (39.6) |
101.1 (38.4) |
98.8 (37.1) |
89.2 (31.8) |
81.5 (27.5) |
76.1 (24.5) |
103.2 (39.6) |
| Mean daily maximum °F (°C) | 40.7 (4.8) |
43.9 (6.6) |
51.9 (11.1) |
64.1 (17.8) |
73.4 (23.0) |
82.7 (28.2) |
86.9 (30.5) |
85.2 (29.6) |
78.3 (25.7) |
67.1 (19.5) |
56.2 (13.4) |
45.1 (7.3) |
64.7 (18.2) |
| Daily mean °F (°C) | 32.4 (0.2) |
34.9 (1.6) |
42.1 (5.6) |
52.8 (11.6) |
62.0 (16.7) |
71.5 (21.9) |
76.1 (24.5) |
74.6 (23.7) |
67.5 (19.7) |
56.0 (13.3) |
46.5 (8.1) |
36.8 (2.7) |
54.5 (12.5) |
| Mean daily minimum °F (°C) | 24.1 (−4.4) |
25.9 (−3.4) |
32.4 (0.2) |
41.6 (5.3) |
50.6 (10.3) |
60.4 (15.8) |
65.3 (18.5) |
64.1 (17.8) |
56.7 (13.7) |
44.9 (7.2) |
36.8 (2.7) |
28.5 (−1.9) |
44.4 (6.9) |
| Record low °F (°C) | −9.6 (−23.1) |
−2.5 (−19.2) |
4.6 (−15.2) |
18.1 (−7.7) |
32.7 (0.4) |
41.6 (5.3) |
47.7 (8.7) |
42.6 (5.9) |
36.3 (2.4) |
25.3 (−3.7) |
12.1 (−11.1) |
0.5 (−17.5) |
−9.6 (−23.1) |
| Average precipitation inches (mm) | 3.57 (91) |
2.73 (69) |
4.28 (109) |
3.86 (98) |
4.14 (105) |
4.24 (108) |
5.07 (129) |
4.31 (109) |
4.10 (104) |
3.69 (94) |
3.44 (87) |
3.94 (100) |
47.37 (1,203) |
| Average relative humidity (%) | 65.2 | 61.5 | 57.8 | 57.0 | 61.9 | 65.9 | 66.2 | 68.6 | 69.3 | 68.5 | 66.9 | 66.8 | 64.7 |
| Average dew point °F (°C) | 22.0 (−5.6) |
23.0 (−5.0) |
28.3 (−2.1) |
38.0 (3.3) |
48.8 (9.3) |
59.5 (15.3) |
64.0 (17.8) |
63.6 (17.6) |
57.1 (13.9) |
45.8 (7.7) |
36.1 (2.3) |
26.8 (−2.9) |
42.8 (6.0) |
| Source: PRISM | |||||||||||||
Getting Around: Transportation
As of 2018, Tullytown had about 12.98 miles (20.89 km) of public roads. The Pennsylvania Department of Transportation (PennDOT) takes care of 6.46 miles (10.39 km) of these roads. The borough itself maintains the other 6.52 miles (10.49 km).
Major Roads
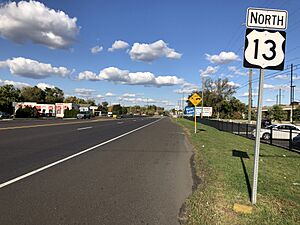
U.S. Route 13 is the main highway that goes through Tullytown. It runs from the southwest to the northeast part of the borough.
Train and Bus Services
Tullytown has a train station called Levittown station. This station is part of SEPTA Regional Rail's Trenton Line. You can take trains from here to Center City Philadelphia and the Trenton Transit Center.
While Amtrak trains also pass through Tullytown on the Northeast Corridor, they do not stop there. The closest Amtrak station is in Trenton.
For bus travel, SEPTA offers Suburban Bus service in Tullytown. Route 127 connects the Oxford Valley Mall to the Trenton Transit Center. Route 128 runs between the Neshaminy Mall and the Oxford Valley Mall.
Nature and Environment: Ecology
Tullytown's natural environment is mostly covered by Appalachian Oak forests. This type of forest is part of the Eastern Hardwood Forest.
Plant Life and Seasons
The area is in a plant hardiness zone 7a. This means the average coldest temperature in winter is about 1.6°F (-16.9°C). Spring flowers usually start to bloom around April 7. The beautiful fall colors typically reach their peak around November 4.
See also
 In Spanish: Tullytown para niños
 | Selma Burke |
 | Pauline Powell Burns |
 | Frederick J. Brown |
 | Robert Blackburn |


