Wairau Valley facts for kids
Quick facts for kids
Wairau Valley
|
|
|---|---|

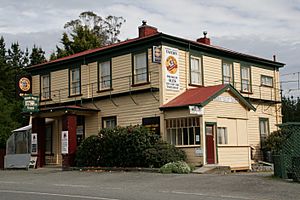
Wairau Valley Tavern
|
|
| Country | New Zealand |
| Region | Marlborough |
| Ward |
|
| Electorates |
|
| Area | |
| • Total | 4,177.50 km2 (1,612.94 sq mi) |
| Population
(June 2023)
|
|
| • Total | 2,200 |
| • Density | 0.527/km2 (1.364/sq mi) |
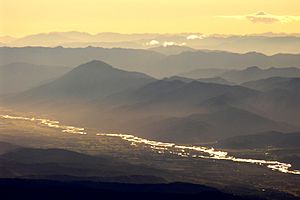
Wairau Valley is a beautiful valley in Marlborough, New Zealand. It's named after the Wairau River that flows through it. The main town in the upper part of the valley is also called Wairau Valley. You can travel through the valley on State Highway 63.
The valley eventually opens up to the Wairau Plain, where towns like Renwick and Blenheim are located. A very important geological feature, the Alpine–Wairau Fault, runs along the entire length of the valley. This is a major fault line where parts of the Earth's crust meet.
Did you know there's a special metal called Wairauite? It's an iron-cobalt alloy and it's named after this very valley!
Contents
History and People of Wairau Valley
Early European Settlers
In November 1842, a surveyor named J. S. Cotterell explored the Wairau Valley. He reported that the land was very rich and good for farming. Soon after, settlers from Nelson, led by Arthur Wakefield, tried to claim this land.
However, the land was already home to the Ngāti Toa Māori people, led by their chiefs Te Rauparaha and Te Rangihaeata. They strongly disagreed with the settlers trying to take their land. This disagreement sadly led to a conflict known as the Wairau Affray. It happened at Tuamarina on June 23, 1843. During this event, 22 settlers and four Māori people lost their lives.
An investigation in 1844 by Governor Robert FitzRoy found that the settlers were in the wrong. Later, in November 1846, farmers from Nelson, Nathaniel Morse and John Cooper, brought sheep into the valley and started new settlements. Governor Sir George Grey officially bought the land that same year, which helped sort out who legally owned it for the settlers.
In 1855, a big earthquake, called the 1855 Wairarapa earthquake, caused the eastern part of the Wairau valley to sink by more than a metre!
Parerarua Marae: A Special Meeting Place
In Wairau Valley, you'll find Parerarua Marae. A marae is a very important meeting ground for Māori people. It's a place for gatherings, ceremonies, and learning. Parerarua Marae belongs to the Ngāti Rārua tribe. It includes a wharenui, which is a special meeting house.
In October 2020, the New Zealand Government helped out by giving $246,418 to renovate the marae. This project also created about 7 jobs for people in the area.
Population and Community Life
Wairau Valley Town Population
Wairau Valley town is a small rural community. It covers about 3.50 square kilometres. In 2018, the town had a population of 231 people. This was an increase of 21 people since 2013, showing the town is slowly growing.
The people living in Wairau Valley town are mostly European/Pākehā (96.1%). A smaller number identify as Māori (6.5%) or Pasifika (2.6%). Most people (63.6%) said they had no religion, while 23.4% were Christian.
Many people in the town work full-time (56.2%), and some work part-time (17.2%). The average income in Wairau Valley town was $29,300 in 2018.
Upper Wairau Area Population
The larger area around the town is called Upper Wairau. This area is much bigger, covering about 4177.50 square kilometres. In 2023, the estimated population for Upper Wairau was 2,040 people.
In 2018, Upper Wairau had 1,938 people. This was an increase of 192 people since 2013. The population here is also mostly European/Pākehā (95.5%), with some Māori (6.3%). About 16.9% of people in Upper Wairau were born overseas.
Education in Wairau Valley
Wairau Valley School is a school for students from Year 1 to Year 8 (ages 5 to 13). As of 2023, it has about 60 students. The first school in the Wairau Valley opened way back in 1861, showing how long education has been important here!
Climate in Wairau Valley
The climate in Wairau Valley has warm summers and cool winters.
| Climate data for Wairau Valley (1991–2020) | |||||||||||||
|---|---|---|---|---|---|---|---|---|---|---|---|---|---|
| Month | Jan | Feb | Mar | Apr | May | Jun | Jul | Aug | Sep | Oct | Nov | Dec | Year |
| Mean daily maximum °C (°F) | 23.9 (75.0) |
23.7 (74.7) |
21.8 (71.2) |
18.3 (64.9) |
15.4 (59.7) |
12.5 (54.5) |
11.9 (53.4) |
13.2 (55.8) |
15.3 (59.5) |
17.7 (63.9) |
19.4 (66.9) |
21.9 (71.4) |
17.9 (64.2) |
| Daily mean °C (°F) | 18.1 (64.6) |
17.7 (63.9) |
15.7 (60.3) |
12.8 (55.0) |
10.2 (50.4) |
7.6 (45.7) |
6.8 (44.2) |
8.2 (46.8) |
10.2 (50.4) |
12.3 (54.1) |
14.0 (57.2) |
16.3 (61.3) |
12.5 (54.5) |
| Mean daily minimum °C (°F) | 12.3 (54.1) |
11.8 (53.2) |
9.6 (49.3) |
7.3 (45.1) |
4.9 (40.8) |
2.6 (36.7) |
1.7 (35.1) |
3.1 (37.6) |
5.1 (41.2) |
6.8 (44.2) |
8.5 (47.3) |
10.7 (51.3) |
7.0 (44.7) |
| Average rainfall mm (inches) | 97.6 (3.84) |
95.6 (3.76) |
78.2 (3.08) |
104.6 (4.12) |
130.5 (5.14) |
123.3 (4.85) |
84.5 (3.33) |
103.0 (4.06) |
94.5 (3.72) |
92.5 (3.64) |
66.4 (2.61) |
82.8 (3.26) |
1,153.5 (45.41) |
| Source: NIWA | |||||||||||||


