Wilbur, Washington facts for kids
Quick facts for kids
Wilbur, Washington
|
|
|---|---|
| Town of Wilbur | |

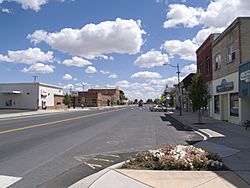
Downtown Wilbur
|
|

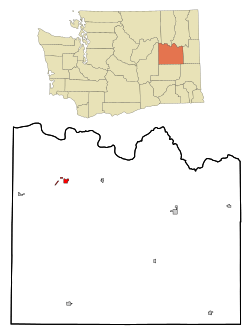
Location of Wilbur, Washington
|
|
| Country | United States |
| State | Washington |
| County | Lincoln |
| Area | |
| • Total | 1.32 sq mi (3.42 km2) |
| • Land | 1.32 sq mi (3.42 km2) |
| • Water | 0.00 sq mi (0.00 km2) |
| Elevation | 2,172 ft (662 m) |
| Population
(2020)
|
|
| • Total | 895 |
| • Estimate
(2021)
|
914 |
| • Density | 678.0/sq mi (261.7/km2) |
| Time zone | UTC-8 (Pacific (PST)) |
| • Summer (DST) | UTC-7 (PDT) |
| ZIP code |
99185
|
| Area code(s) | 509 |
| FIPS code | 53-78680 |
| GNIS feature ID | 1509502 |
Wilbur is a small town located in Lincoln County, Washington, in the United States. In 2020, about 895 people lived there. It's a quiet place with an interesting history.
Contents
History of Wilbur
How Wilbur Got Its Name
Before 1889, there were no towns west of Davenport in Lincoln County. A man named Samuel Wilbur Condit had a ranch there. People called him "Wild Goose Bill." The government set up a post office at his ranch.
The town was first called "Goosetown" to honor him. But the local blacksmith's wife didn't like the name. She thought it sounded silly. So, in 1889, the town was renamed "Wilbur" instead.
Early Growth and Challenges
Wilbur was located on an important stagecoach route. This route connected Davenport to the mining areas in northern Washington. When the Central Washington Railroad arrived in 1889, the town started to grow quickly.
New businesses opened, like hotels, a bank, and a lumber mill. Wilbur officially became a town on August 11, 1890. However, growth slowed down by 1891. A big fire in October 1891 caused a lot of damage.
Bouncing Back and Modern Times
Wilbur recovered from the tough times in the 1890s. A huge wheat harvest in 1897 brought a lot of money to the town. Another fire in 1901 destroyed several blocks. This led to the town building a water system in 1903. Wilbur also got electricity in October 1903.
In recent years, Wilbur has been in the news for something mysterious. In July 2007, strange crop circles appeared in wheat fields nearby. These patterns in the crops were a mystery. More crop circles were found in August 2009 and July 2012.
Wilbur's Geography
Wilbur is in the northwestern part of Lincoln County. It's located on U.S. Route 2. This is about 14 miles (23 km) south of Franklin D. Roosevelt Lake. The town is also connected by other state highways. State Route 21 goes north to the Keller Ferry and south to Interstate 90. State Route 174 travels northwest to the Grand Coulee Dam.
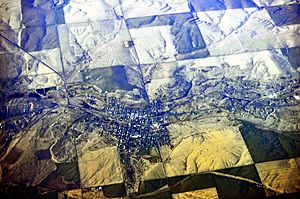
Wilbur sits in a long, oval-shaped valley. A stream called Goose Creek runs through the middle of town. This creek is also named after Wild Goose Bill. There are steep, rocky cliffs on the north and south sides of the valley. Long ago, this area might have been a lake.
The town covers about 1.37 square miles (3.55 square kilometers) of land. There is no water area within the town limits.
Climate in Wilbur
Wilbur has a semi-arid climate. This means it's usually dry, but not a desert. It's also close to a humid continental climate, which has more moisture.
| Climate data for Wilbur | |||||||||||||
|---|---|---|---|---|---|---|---|---|---|---|---|---|---|
| Month | Jan | Feb | Mar | Apr | May | Jun | Jul | Aug | Sep | Oct | Nov | Dec | Year |
| Record high °F (°C) | 53 (12) |
61 (16) |
75 (24) |
90 (32) |
96 (36) |
110 (43) |
110 (43) |
106 (41) |
100 (38) |
87 (31) |
69 (21) |
56 (13) |
110 (43) |
| Mean daily maximum °F (°C) | 31.6 (−0.2) |
38.2 (3.4) |
49.0 (9.4) |
59.6 (15.3) |
68.7 (20.4) |
76.0 (24.4) |
85.1 (29.5) |
83.9 (28.8) |
74.6 (23.7) |
60.7 (15.9) |
42.9 (6.1) |
33.5 (0.8) |
58.7 (14.8) |
| Mean daily minimum °F (°C) | 17.6 (−8.0) |
21.9 (−5.6) |
28.1 (−2.2) |
32.8 (0.4) |
39.2 (4.0) |
44.8 (7.1) |
49.5 (9.7) |
48.6 (9.2) |
41.9 (5.5) |
33.6 (0.9) |
26.9 (−2.8) |
20.9 (−6.2) |
33.8 (1.0) |
| Record low °F (°C) | −27 (−33) |
−30 (−34) |
−4 (−20) |
10 (−12) |
19 (−7) |
25 (−4) |
25 (−4) |
25 (−4) |
14 (−10) |
1 (−17) |
−18 (−28) |
−23 (−31) |
−30 (−34) |
| Average precipitation inches (mm) | 1.4 (36) |
1.11 (28) |
0.98 (25) |
0.89 (23) |
1.2 (30) |
1 (25) |
0.52 (13) |
0.49 (12) |
0.59 (15) |
0.99 (25) |
1.62 (41) |
1.63 (41) |
12.42 (315) |
| Average snowfall inches (cm) | 8.4 (21) |
4.6 (12) |
1.3 (3.3) |
0.3 (0.76) |
0 (0) |
0 (0) |
0 (0) |
0 (0) |
0 (0) |
0.1 (0.25) |
3.1 (7.9) |
8.1 (21) |
25.9 (66) |
| Average precipitation days | 8 | 6 | 6 | 5 | 6 | 5 | 3 | 3 | 4 | 6 | 8 | 8 | 68 |
Population of Wilbur
Population Over Time
The population of Wilbur has changed over the years. Here's a look at how many people have lived there during different census counts:
| Historical population | |||
|---|---|---|---|
| Census | Pop. | %± | |
| 1890 | 410 | — | |
| 1900 | 595 | 45.1% | |
| 1910 | 757 | 27.2% | |
| 1920 | 870 | 14.9% | |
| 1930 | 737 | −15.3% | |
| 1940 | 1,011 | 37.2% | |
| 1950 | 1,043 | 3.2% | |
| 1960 | 1,138 | 9.1% | |
| 1970 | 1,074 | −5.6% | |
| 1980 | 1,122 | 4.5% | |
| 1990 | 863 | −23.1% | |
| 2000 | 914 | 5.9% | |
| 2010 | 884 | −3.3% | |
| 2020 | 895 | 1.2% | |
| 2021 (est.) | 914 | 3.4% | |
| U.S. Decennial Census 2020 Census |
|||
Wilbur in 2010
In 2010, there were 884 people living in Wilbur. These people lived in 404 households. About 243 of these were families. The town had about 645 people per square mile (249 people per square kilometer).
Most people in Wilbur were White (93.4%). There were also small numbers of Native American, Asian, and African American residents. About 2.3% of the population was Hispanic or Latino.
About 22.8% of households had children under 18. Many households (50.7%) were married couples living together. About 35.1% of households were single individuals. A good number of people (20%) lived alone and were 65 years old or older.
The average age in Wilbur was 50.2 years. About 20.4% of residents were under 18. And 25.2% were 65 years or older. The town had slightly more females (52.7%) than males (47.3%).
See also
 In Spanish: Wilbur (Washington) para niños


