Alameda de la Sagra facts for kids
Quick facts for kids
Alameda de la Sagra
|
|||
|---|---|---|---|

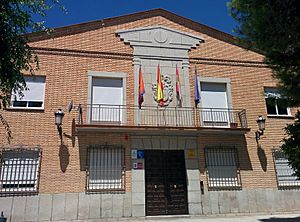
Town Hall
|
|||
|
|||
 |
|||
| Country | |||
| Autonomous community | Castile-La Mancha | ||
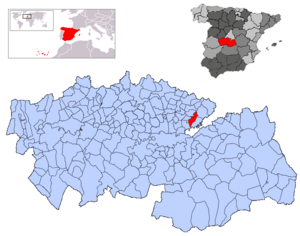
| Province | Toledo | ||
| Comarca | La Sagra | ||
| Judicial district | Illescas | ||
| Founded | Ver texto | ||
| Area | |||
| • Total | 33.03 km2 (12.75 sq mi) | ||
| Elevation | 632 m (2,073 ft) | ||
| Population
(2018)
|
|||
| • Total | 3,562 | ||
| • Density | 107.841/km2 (279.31/sq mi) | ||
| Demonyms | Alamedano, na Alamedo, da |
||
| Time zone | UTC+1 (CET) | ||
| • Summer (DST) | UTC+2 (CEST) | ||
| Postal code |
45240
|
||
| Dialing code | 925 | ||
Alameda de la Sagra is a town in Spain. It is a municipality located in the province of Toledo. This province is part of the Castile-La Mancha region. In 2008, about 3,324 people lived there.
Contents
History of Alameda de la Sagra
The town of Alameda de la Sagra started a long time ago. It began in the 14th century. People who worked with plaster, called plasterers, moved here. They came from a nearby town called Cobeja. They settled in this area because it had a lot of gypsum. Gypsum is a mineral used to make plaster.
The Church in Toledo owned this land. They had owned it since the 12th century. The Church allowed these plasterers to build their homes here. At first, the homes were simple wooden shacks and farmhouses. But around 1530, people started building stronger homes. They used masonry, which means building with stone or brick.
Geography of Alameda de la Sagra
Alameda de la Sagra is on a flat area called a plateau. This plateau has a lot of gypsum. The town is part of a region known as La Sagra.
Several other towns are close to Alameda de la Sagra. These include Borox, Añover de Tajo, Villaseca de la Sagra, Cobeja, and Pantoja.
The town gets its water from two main sources. The important Tagus river flows through the area. There is also a smaller water source called the Guadalén stream. Both of these cross the municipality.
Population Changes Over Time
The number of people living in Alameda de la Sagra has changed over the years. This information helps us understand how the town has grown.
| Historical population | ||
|---|---|---|
| Year | Pop. | ±% |
| 1900 | 1,151 | — |
| 1910 | 1,279 | +11.1% |
| 1920 | 1,396 | +9.1% |
| 1930 | 1,657 | +18.7% |
| 1940 | 1,575 | −4.9% |
| 1950 | 1,639 | +4.1% |
| 1960 | 1,816 | +10.8% |
| 1970 | 2,274 | +25.2% |
| 1981 | 2,611 | +14.8% |
| 1991 | 2,724 | +4.3% |
| 2001 | 2,841 | +4.3% |
| 2011 | 3,487 | +22.7% |
| 2021 | 3,757 | +7.7% |
| 2023 | 4,149 | +10.4% |
| Source: INE | ||
See also
 In Spanish: Alameda de la Sagra para niños
 | Selma Burke |
 | Pauline Powell Burns |
 | Frederick J. Brown |
 | Robert Blackburn |


