
Climate of Hawaii facts for kids
The U.S. state of Hawaiʻi is a tropical paradise, but it has many different climates! This depends on how high up you are and what's around you. For example, the island of Hawaiʻi (also called the Big Island) has 4 out of 5 main climate types found on Earth. These are tropical, dry, mild, and even polar climates. All this is packed into an area about the size of Connecticut (4,028 square miles)!
If you count smaller climate types, the Big Island has 10 out of 14 possible climate zones. That's a lot for one island! Most of the rain in Hawaiʻi comes from "trade winds." These winds blow onto the north and east sides of the islands. When the moist air hits the mountains, it rises and cools, making rain. This is called orographic precipitation. Coastal areas are usually drier, especially the south and west sides, which are called the "leeward" sides.
Because of climate change, Hawaiʻi is generally getting drier and hotter. The islands get most of their rain from October to April. The drier months are usually from May to September. Luckily, the waters around Hawaiʻi are cooler. This means there's a low chance of strong tropical storms, like hurricanes.
Contents
Temperature in Hawaiʻi
Near the ocean, temperatures are usually warm. In summer, highs are around 84-88°F (29-31°C). In winter, they are about 79-83°F (26-28°C). It's rare for temperatures at low elevations to go above 90°F (32°C) or below 60°F (16°C).
Temperatures get much cooler as you go higher up the mountains. In winter, snow often falls on the tops of Mauna Kea and Mauna Loa on Hawaiʻi Island. On Maui, the top of Haleakalā sometimes gets snow too. In February 2019, snow was even seen at 6,200 feet (1,890 meters) on Haleakalā! This was unusual. The coldest temperature ever recorded in Honolulu was 52°F (11°C) on January 20, 1969.
Overall, Hawaiʻi is getting hotter due to global warming. Temperatures of 90°F (32°C) or more are not common. However, they can happen in dry, leeward (sheltered) areas. In these spots, temperatures might reach the low 90s a few days a year. The highest temperature ever recorded in Hawaiʻi was 100°F (38°C). This happened on April 27, 1931, in Pāhala.
The ocean water around Hawaiʻi is also warm. It ranges from about 75°F (24°C) in late winter to 82°F (28°C) in early fall. Only Florida in the U.S. has warmer ocean temperatures for swimming.
The "Pacific High" is a large area of high air pressure. It moves north and south with the sun's position. This brings steady trade winds from May through September. During these months, trade winds blow 80% to 95% of the time. From October to April, the main trade wind area moves south of Hawaiʻi. So, the winds are generally lighter across the islands. Hawaiʻi is at the northern edge of the tropics. This means it has only weak wet and dry seasons, unlike many other tropical places.
Winds in Hawaiʻi
Wind patterns on the islands are very complicated. Even though trade winds are usually steady, mountains, hills, and valleys change their flow. Winds often blow up the slopes during the day and down the slopes at night.
Sometimes, very strong local winds happen. These are not fully understood. They are very localized and can reach speeds of 60 to 100 mph (97 to 161 km/h). Two well-known examples are the Kula and Lāhainā winds on Maui.
The Kula winds are strong winds that blow down the lower slopes of western Haleakalā. They are usually strongest between 2,000 and 4,000 feet (610 and 1,220 meters) above sea level.
The Lāhainā winds are also downslope winds, but they are different. They are sometimes called "lehua winds." This is because red ʻōhiʻa lehua blossoms fill the air when these strong winds blow. These winds come from canyons at the base of the western Maui mountains. They are extremely strong, reaching 80 to 100 mph (129 to 161 km/h) or more. Luckily, they only happen every 8 to 12 years.

Cloud Formation
When trade winds blow, there's often a clear change in moisture in the air. Below 4,000 to 8,000 feet (1,220 to 2,440 meters), the air is moist. Above these heights, it's dry. This change is caused by a "temperature inversion." This is like a lid in the air that stops clouds from growing too tall. The inversion is present 50% to 70% of the time. Its height changes daily but is usually between 5,000 and 7,000 feet (1,520 and 2,130 meters).
On trade wind days with a strong inversion, clouds form below this "lid." Only a few cloud tops might break through. These tall clouds form along the mountains. This happens when the trade wind air is pushed up and over the mountains. On days without an inversion, the sky is almost clear. Completely clear skies are very rare.
In leeward areas, which are sheltered from the trade winds, skies are clear 30% to 60% of the time. Windward areas tend to be cloudier in the summer. This is when trade winds and their clouds are more common. Leeward areas are less affected by trade wind clouds. They tend to be cloudier in winter when storm fronts pass through more often.
On Maui, the cloudiest places are near the mountain tops. Also, elevations of 2,000 to 4,000 feet (610 to 1,220 meters) on the windward side of Haleakalā are very cloudy. In these spots, the sky is cloudy more than 70% of the time. The air in the high mountains is usually very clear because it has little moisture.
Precipitation
Hawaiʻi is different from many tropical places. It has a wet season that happens in the winter months. This is unusual, as most tropical places have their wet season in the summer. For example, Honolulu's climate is a rare type where the wet season is in winter.
Overall, Hawaiʻi is getting drier due to climate change. Big storms happen most often from October through March. There can be six or seven major storms in a year. These storms bring heavy rains and strong local winds. They might be linked to a cold front. A cold front is the leading edge of cooler air moving across the islands.
The average yearly rainfall varies a lot. It can be as little as 7.4 inches (188 mm) on the top of Mauna Kea. It can be as much as 404 inches (10,271 mm) in Big Bog. Windward slopes get much more rain than the drier lowlands and tall mountains on the leeward side.
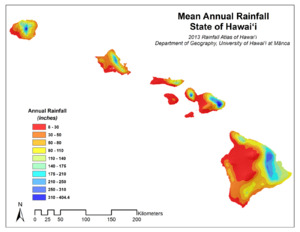
On windward coasts, many short, light showers are common. These usually don't produce much rain. Heavy rains happen with a sudden increase in trade winds or a major storm. Hāna has received as much as 28 inches (711 mm) of rain in just one day!
Severe thunderstorms are not very common. These are storms with tornadoes, large hail (1 inch or bigger), or strong winds (at least 58 mph). Waterspouts (tornadoes over water) are more common than tornadoes that form over land. About one tornado, on average, happens each year.
Kona storms happen in the winter. The name comes from winds blowing from the "kona" or leeward direction. Rain from a strong Kona storm is widespread and lasts longer than from a cold front storm. Kona storm rains are usually heaviest in an arc south to east of the storm's center. These rains can last from several hours to several days. They might be steady or have breaks with lighter rain or partial clearing. Sometimes, an entire winter goes by without a single strong Kona storm. More often, there are one or two a year, sometimes four or five.
Hurricanes
The hurricane season in Hawaiʻi is usually from June through November. This is when hurricanes and tropical storms are most likely in the North Pacific. These storms often start off the coast of Mexico. Then they move west or northwest towards the islands. As storms cross the Pacific, they tend to lose strength if they move north into cooler water.
True hurricanes are rare in Hawaiʻi. This is partly because of the cooler waters around the islands. Also, the air conditions are often not good for hurricanes to form or strengthen. Only four hurricanes have directly hit the islands in 63 years (as of February 2018). Tropical storms are more frequent. These have weaker winds, below 74 mph (119 km/h).
It's hard to know exactly how often tropical storms happened in the past. This is because early records didn't always tell the difference between them and Kona storms. About every year or two, a tropical storm affects the weather in some part of the islands. Unlike cold fronts and Kona storms, hurricanes and tropical storms are most likely from July through December.
Three strong and damaging hurricanes are known to have hit the islands:
- An unnamed storm in 1871
- Hurricane Dot in 1959
- Hurricane ʻIniki in 1992
Another hurricane, ʻIwa, caused a lot of damage in 1982. But its center passed nearby and didn't directly hit land. The rarity of hurricanes hitting the islands might change as the climate gets warmer. In the past, when carbon dioxide levels were similar to today, the waters around Hawaiʻi were much warmer. This led to many hurricane strikes in computer models.
How Hawaiʻi Affects Trade Winds


Even though the Hawaiian Islands are small, they have a surprising effect on ocean currents and wind patterns across a large part of the Pacific Ocean. In the Northern Hemisphere, trade winds usually blow from the northeast to the southwest. They blow from North and South America towards Asia. Normally, these winds continue across the Pacific unless something blocks them, like an island.
Hawaiʻi's tall mountains are a big obstacle for the trade winds. The high land blocks the airflow, splitting the trade winds into two paths. This creates an area of weak winds on the leeward side of the islands. This area is called a "wind wake."
Scientists used to think that an island's wind wake would disappear within a few hundred kilometers. They didn't expect it to be felt far away in the western Pacific. However, the wind wake caused by the Hawaiian Islands stretches for 1,860 miles (3,000 km)! This is about 10 times longer than any other known wake. This very long wake shows how strongly the air and ocean interact. This is important for understanding global climate and natural climate changes like El Niño.
There are several reasons why this long wake is only seen in Hawaiʻi:
- First, the ocean reacts slowly to fast-changing winds. Winds need to be steady, like the trade winds, to affect the ocean.
- Second, the tall mountains cause a significant change in the winds.
- Third, the Hawaiian Islands are wide, stretching over four degrees of longitude.
It's this active connection between wind, ocean currents, and temperature that creates this uniquely long wake west of Hawaiʻi.
The wind wake also creates an eastward "counter current." This current brings warm water 5,000 miles (8,000 km) from the Asian coast. This warm water then causes more changes in the wind. This allows the island's effect to reach far into the western Pacific. Oceanographers had seen this counter current near the Hawaiian Islands years before the long wake was discovered. But they didn't know what caused it until now.
Statistics
State
| Climate data for Hawaiʻi | |||||||||||||
|---|---|---|---|---|---|---|---|---|---|---|---|---|---|
| Month | Jan | Feb | Mar | Apr | May | Jun | Jul | Aug | Sep | Oct | Nov | Dec | Year |
| Record high °F (°C) | 93 (34) |
94 (34) |
95 (35) |
96 (36) |
98 (37) |
97 (36) |
98 (37) |
100 (38) |
98 (37) |
97 (36) |
96 (36) |
97 (36) |
100 (38) |
| Mean daily maximum °F (°C) | 81 (27) |
81 (27) |
82 (28) |
84 (29) |
86 (30) |
88 (31) |
88 (31) |
90 (32) |
90 (32) |
88 (31) |
84 (29) |
82 (28) |
85 (30) |
| Mean daily minimum °F (°C) | 64 (18) |
66 (19) |
68 (20) |
70 (21) |
70 (21) |
72 (22) |
73 (23) |
75 (24) |
73 (23) |
73 (23) |
72 (22) |
66 (19) |
70 (21) |
| Record low °F (°C) | 14 (−10) |
12 (−11) |
18 (−8) |
18 (−8) |
12 (−11) |
23 (−5) |
22 (−6) |
17 (−8) |
23 (−5) |
20 (−7) |
20 (−7) |
17 (−8) |
12 (−11) |
| Average precipitation inches (mm) | 3.07 (78) |
3.54 (90) |
3.46 (88) |
2.05 (52) |
1.50 (38) |
1.69 (43) |
2.24 (57) |
1.34 (34) |
2.40 (61) |
3.15 (80) |
4.88 (124) |
3.43 (87) |
32.75 (832) |
| Average precipitation days | 18 | 16 | 19 | 19 | 18 | 20 | 22 | 19 | 17 | 18 | 20 | 19 | 225 |
| Source: Holiday Weather | |||||||||||||
Major cities
| Climate data for Hilo International Airport, Hawaiʻi (1981–2010 normals, extremes 1949–present) | |||||||||||||
|---|---|---|---|---|---|---|---|---|---|---|---|---|---|
| Month | Jan | Feb | Mar | Apr | May | Jun | Jul | Aug | Sep | Oct | Nov | Dec | Year |
| Record high °F (°C) | 92 (33) |
92 (33) |
93 (34) |
89 (32) |
94 (34) |
90 (32) |
91 (33) |
93 (34) |
93 (34) |
91 (33) |
94 (34) |
93 (34) |
94 (34) |
| Mean maximum °F (°C) | 84.9 (29.4) |
84.8 (29.3) |
84.4 (29.1) |
83.3 (28.5) |
84.6 (29.2) |
85.6 (29.8) |
86.3 (30.2) |
86.9 (30.5) |
86.8 (30.4) |
86.9 (30.5) |
85.6 (29.8) |
84.2 (29.0) |
88.9 (31.6) |
| Mean daily maximum °F (°C) | 79.0 (26.1) |
78.8 (26.0) |
79.0 (26.1) |
78.9 (26.1) |
80.6 (27.0) |
82.2 (27.9) |
82.8 (28.2) |
83.2 (28.4) |
83.3 (28.5) |
82.6 (28.1) |
80.8 (27.1) |
79.4 (26.3) |
80.8 (27.1) |
| Daily mean °F (°C) | 71.4 (21.9) |
71.2 (21.8) |
71.8 (22.1) |
72.2 (22.3) |
73.7 (23.2) |
75.2 (24.0) |
76.1 (24.5) |
76.4 (24.7) |
76.2 (24.6) |
75.6 (24.2) |
74.1 (23.4) |
72.3 (22.4) |
73.9 (23.3) |
| Mean daily minimum °F (°C) | 63.8 (17.7) |
63.5 (17.5) |
64.6 (18.1) |
65.5 (18.6) |
66.9 (19.4) |
68.2 (20.1) |
69.2 (20.7) |
69.3 (20.7) |
69.7 (20.9) |
69.1 (20.6) |
67.3 (19.6) |
65.1 (18.4) |
66.9 (19.4) |
| Mean minimum °F (°C) | 59.0 (15.0) |
58.5 (14.7) |
60.3 (15.7) |
62.0 (16.7) |
63.1 (17.3) |
65.0 (18.3) |
65.8 (18.8) |
66.0 (18.9) |
65.6 (18.7) |
64.7 (18.2) |
63.2 (17.3) |
60.5 (15.8) |
57.9 (14.4) |
| Record low °F (°C) | 54 (12) |
53 (12) |
54 (12) |
58 (14) |
59 (15) |
61 (16) |
62 (17) |
63 (17) |
61 (16) |
62 (17) |
58 (14) |
55 (13) |
53 (12) |
| Average rainfall inches (mm) | 9.26 (235) |
9.56 (243) |
13.43 (341) |
11.54 (293) |
8.12 (206) |
7.37 (187) |
10.81 (275) |
9.85 (250) |
9.94 (252) |
9.77 (248) |
15.50 (394) |
11.57 (294) |
126.72 (3,219) |
| Average rainy days (≥ 0.01 in) | 16.3 | 15.8 | 21.4 | 24.9 | 23.5 | 25.1 | 26.8 | 26.8 | 24.3 | 23.6 | 23.0 | 20.6 | 272.1 |
| Average relative humidity (%) | 76.6 | 76.0 | 78.1 | 80.2 | 78.9 | 77.4 | 79.5 | 79.5 | 79.2 | 80.0 | 80.3 | 78.7 | 78.7 |
| Mean monthly sunshine hours | 161.0 | 152.0 | 152.7 | 135.9 | 155.0 | 176.9 | 167.2 | 174.9 | 161.5 | 136.3 | 115.0 | 129.0 | 1,817.4 |
| Percent possible sunshine | 47 | 47 | 41 | 36 | 38 | 44 | 41 | 44 | 44 | 38 | 34 | 38 | 41 |
| Source: NOAA (relative humidity and sun 1961−1990) | |||||||||||||
| Climate data for Honolulu International Airport (1981−2010 normals, extremes 1877−present ) | |||||||||||||
|---|---|---|---|---|---|---|---|---|---|---|---|---|---|
| Month | Jan | Feb | Mar | Apr | May | Jun | Jul | Aug | Sep | Oct | Nov | Dec | Year |
| Record high °F (°C) | 88 (31) |
88 (31) |
89 (32) |
91 (33) |
93 (34) |
92 (33) |
94 (34) |
93 (34) |
95 (35) |
94 (34) |
93 (34) |
89 (32) |
95 (35) |
| Mean maximum °F (°C) | 84.3 (29.1) |
84.4 (29.1) |
85.4 (29.7) |
86.6 (30.3) |
88.7 (31.5) |
89.5 (31.9) |
90.7 (32.6) |
91.3 (32.9) |
91.7 (33.2) |
90.5 (32.5) |
87.6 (30.9) |
85.2 (29.6) |
92.1 (33.4) |
| Mean daily maximum °F (°C) | 80.1 (26.7) |
80.2 (26.8) |
81.2 (27.3) |
82.7 (28.2) |
84.6 (29.2) |
87.0 (30.6) |
87.9 (31.1) |
88.7 (31.5) |
88.6 (31.4) |
86.7 (30.4) |
83.9 (28.8) |
81.2 (27.3) |
84.4 (29.1) |
| Daily mean °F (°C) | 73.2 (22.9) |
73.1 (22.8) |
74.5 (23.6) |
76.1 (24.5) |
77.8 (25.4) |
80.2 (26.8) |
81.2 (27.3) |
81.9 (27.7) |
81.5 (27.5) |
80.0 (26.7) |
77.6 (25.3) |
74.8 (23.8) |
77.7 (25.4) |
| Mean daily minimum °F (°C) | 66.3 (19.1) |
66.1 (18.9) |
67.7 (19.8) |
69.4 (20.8) |
70.9 (21.6) |
73.4 (23.0) |
74.5 (23.6) |
75.1 (23.9) |
74.4 (23.6) |
73.4 (23.0) |
71.4 (21.9) |
68.3 (20.2) |
70.9 (21.6) |
| Mean minimum °F (°C) | 59.3 (15.2) |
58.6 (14.8) |
61.2 (16.2) |
64.2 (17.9) |
65.3 (18.5) |
69.6 (20.9) |
70.8 (21.6) |
70.8 (21.6) |
70.1 (21.2) |
68.1 (20.1) |
65.4 (18.6) |
61.1 (16.2) |
57.0 (13.9) |
| Record low °F (°C) | 52 (11) |
52 (11) |
53 (12) |
56 (13) |
60 (16) |
63 (17) |
63 (17) |
63 (17) |
65 (18) |
61 (16) |
57 (14) |
54 (12) |
52 (11) |
| Average rainfall inches (mm) | 2.31 (59) |
1.99 (51) |
2.02 (51) |
0.63 (16) |
0.62 (16) |
0.26 (6.6) |
0.51 (13) |
0.56 (14) |
0.70 (18) |
1.84 (47) |
2.42 (61) |
3.24 (82) |
17.10 (434) |
| Average rainy days (≥ 0.01 inch) | 8.5 | 7.4 | 8.8 | 7.5 | 5.8 | 5.7 | 7.1 | 5.6 | 6.9 | 7.6 | 8.8 | 9.7 | 89.4 |
| Average relative humidity (%) | 73.3 | 70.8 | 68.8 | 67.3 | 66.1 | 64.4 | 64.6 | 64.1 | 65.5 | 67.5 | 70.4 | 72.4 | 67.9 |
| Mean monthly sunshine hours | 213.5 | 212.7 | 259.2 | 251.8 | 280.6 | 286.1 | 306.2 | 303.1 | 278.8 | 244.0 | 200.4 | 199.5 | 3,035.9 |
| Percent possible sunshine | 63 | 66 | 69 | 66 | 69 | 71 | 74 | 76 | 76 | 68 | 60 | 59 | 68 |
| Source: NOAA (relative humidity and sun 1961–1990) | |||||||||||||
| Weather chart for Honolulu | |||||||||||||||||||||||||||||||||||||||||||||||
|---|---|---|---|---|---|---|---|---|---|---|---|---|---|---|---|---|---|---|---|---|---|---|---|---|---|---|---|---|---|---|---|---|---|---|---|---|---|---|---|---|---|---|---|---|---|---|---|
| J | F | M | A | M | J | J | A | S | O | N | D | ||||||||||||||||||||||||||||||||||||
|
2.3
80
66
|
2
80
66
|
2
81
68
|
0.6
83
69
|
0.6
85
71
|
0.3
87
73
|
0.5
88
75
|
0.6
89
75
|
0.7
89
74
|
1.8
87
73
|
2.4
84
71
|
3.2
81
68
|
||||||||||||||||||||||||||||||||||||
| temperatures in °F precipitation totals in inches source: National Climate Data Center |
|||||||||||||||||||||||||||||||||||||||||||||||
|
Metric conversion
|
|||||||||||||||||||||||||||||||||||||||||||||||
| Weather chart for Hilo | |||||||||||||||||||||||||||||||||||||||||||||||
|---|---|---|---|---|---|---|---|---|---|---|---|---|---|---|---|---|---|---|---|---|---|---|---|---|---|---|---|---|---|---|---|---|---|---|---|---|---|---|---|---|---|---|---|---|---|---|---|
| J | F | M | A | M | J | J | A | S | O | N | D | ||||||||||||||||||||||||||||||||||||
|
9.3
79
64
|
9.6
79
64
|
13
79
65
|
12
79
66
|
8.1
81
67
|
7.4
82
68
|
11
83
69
|
9.9
83
70
|
9.9
83
69
|
9.8
83
69
|
16
81
67
|
12
79
65
|
||||||||||||||||||||||||||||||||||||
| temperatures in °F precipitation totals in inches source: National Climate Data Center |
|||||||||||||||||||||||||||||||||||||||||||||||
|
Metric conversion
|
|||||||||||||||||||||||||||||||||||||||||||||||
| Weather chart for Kahului | |||||||||||||||||||||||||||||||||||||||||||||||
|---|---|---|---|---|---|---|---|---|---|---|---|---|---|---|---|---|---|---|---|---|---|---|---|---|---|---|---|---|---|---|---|---|---|---|---|---|---|---|---|---|---|---|---|---|---|---|---|
| J | F | M | A | M | J | J | A | S | O | N | D | ||||||||||||||||||||||||||||||||||||
|
2.9
81
63
|
1.9
81
63
|
2.5
81
64
|
1.6
82
66
|
0.7
84
67
|
0.2
86
70
|
0.5
87
71
|
0.5
88
71
|
0.4
88
70
|
1.2
87
70
|
2.2
84
68
|
3.4
82
65
|
||||||||||||||||||||||||||||||||||||
| temperatures in °F precipitation totals in inches source: National Climate Data Center |
|||||||||||||||||||||||||||||||||||||||||||||||
|
Metric conversion
|
|||||||||||||||||||||||||||||||||||||||||||||||
| Weather chart for Līhuʻe | |||||||||||||||||||||||||||||||||||||||||||||||
|---|---|---|---|---|---|---|---|---|---|---|---|---|---|---|---|---|---|---|---|---|---|---|---|---|---|---|---|---|---|---|---|---|---|---|---|---|---|---|---|---|---|---|---|---|---|---|---|
| J | F | M | A | M | J | J | A | S | O | N | D | ||||||||||||||||||||||||||||||||||||
|
3.8
78
66
|
3.2
78
66
|
4.6
78
67
|
2.3
79
69
|
2.1
81
70
|
1.6
83
73
|
1.9
84
74
|
2.1
85
75
|
2.1
85
74
|
3.8
83
73
|
4.5
81
71
|
5.2
79
68
|
||||||||||||||||||||||||||||||||||||
| temperatures in °F precipitation totals in inches source: National Climate Data Center |
|||||||||||||||||||||||||||||||||||||||||||||||
|
Metric conversion
|
|||||||||||||||||||||||||||||||||||||||||||||||
| Weather chart for Lānaʻi City | |||||||||||||||||||||||||||||||||||||||||||||||
|---|---|---|---|---|---|---|---|---|---|---|---|---|---|---|---|---|---|---|---|---|---|---|---|---|---|---|---|---|---|---|---|---|---|---|---|---|---|---|---|---|---|---|---|---|---|---|---|
| J | F | M | A | M | J | J | A | S | O | N | D | ||||||||||||||||||||||||||||||||||||
|
2.5
76
60
|
1.6
76
60
|
1.6
77
61
|
0.9
78
61
|
0.5
80
63
|
0.6
82
65
|
0.4
83
66
|
0.5
84
67
|
0.9
83
67
|
1.4
82
66
|
2.4
79
64
|
2.2
77
61
|
||||||||||||||||||||||||||||||||||||
| temperatures in °F precipitation totals in inches source: National Climate Data Center |
|||||||||||||||||||||||||||||||||||||||||||||||
|
Metric conversion
|
|||||||||||||||||||||||||||||||||||||||||||||||
Images for kids
-
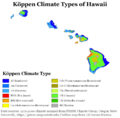
Köppen climate types of Hawaii, using 1971-2000 climate normals.

