Coalport, Pennsylvania facts for kids
Quick facts for kids
Coalport, Pennsylvania
|
|
|---|---|
|
Borough
|
|

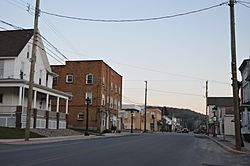
Main Street south of Spruce
|
|

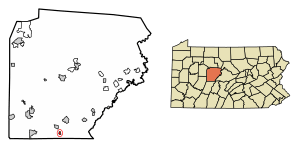
Location of Coalport in Clearfield County, Pennsylvania.
|
|

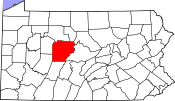
Map showing Clearfield County in Pennsylvania
|
|
| Country | United States |
| State | Pennsylvania |
| County | Clearfield |
| Settled | 1876 |
| Incorporated | 1883 |
| Government | |
| • Type | Borough Council |
| Area | |
| • Total | 0.38 sq mi (0.98 km2) |
| • Land | 0.37 sq mi (0.97 km2) |
| • Water | 0.01 sq mi (0.01 km2) |
| Elevation | 1,382 ft (421 m) |
| Population
(2020)
|
|
| • Total | 425 |
| • Density | 1,136.36/sq mi (438.67/km2) |
| Time zone | UTC-5 (Eastern (EST)) |
| • Summer (DST) | UTC-4 (EDT) |
| ZIP code |
16627
|
| Area code(s) | 814 |
| FIPS code | 42-14656 |
Coalport is a small town, also called a borough, located in Clearfield County, Pennsylvania, United States. In 2020, about 425 people lived there.
Coalport was first settled in 1876. It officially became a borough in 1883.
Contents
Where is Coalport Located?
Coalport is in the southern part of Clearfield County. It sits on the east side of Clearfield Creek. This creek flows north into the West Branch Susquehanna River.
Pennsylvania Route 53 goes right through Coalport. This road connects Coalport to Irvona (about 2 miles north) and Flinton (about 2 miles south). Flinton is in Cambria County.
How Big is Coalport?
The United States Census Bureau says Coalport covers a total area of about 0.38 square miles (0.98 square kilometers). Most of this area is land. Only a tiny part, about 0.01 square miles (0.01 square kilometers), is water. This means about 1.45% of Coalport's area is water.
Who Lives in Coalport?
The number of people living in Coalport has changed over the years. Here's a quick look at the population from different census counts:
| Historical population | |||
|---|---|---|---|
| Census | Pop. | %± | |
| 1890 | 855 | — | |
| 1900 | 938 | 9.7% | |
| 1910 | 876 | −6.6% | |
| 1920 | 1,079 | 23.2% | |
| 1930 | 1,222 | 13.3% | |
| 1940 | 1,121 | −8.3% | |
| 1950 | 1,052 | −6.2% | |
| 1960 | 821 | −22.0% | |
| 1970 | 796 | −3.0% | |
| 1980 | 739 | −7.2% | |
| 1990 | 578 | −21.8% | |
| 2000 | 490 | −15.2% | |
| 2010 | 523 | 6.7% | |
| 2020 | 425 | −18.7% | |
| 2021 (est.) | 426 | −18.5% | |
| Sources: | |||
In 2000, there were 490 people living in Coalport. These people lived in 223 different homes. About 132 of these were families. The population density was about 1,274 people per square mile.
Community Life in Coalport
In 2000, about 21% of homes in Coalport had children under 18. Almost half, 45.7%, were married couples living together. Some homes had a single female parent. Others were made up of individuals living alone.
The average number of people in a home was 2.20. For families, the average was 2.89 people.
Age Groups in Coalport
The population of Coalport in 2000 included people of all ages. About 19% were under 18 years old. Around 9.4% were young adults aged 18 to 24. The largest group, 27.6%, was between 25 and 44 years old.
About 25.3% were between 45 and 64 years old. Finally, 18.8% were 65 years or older. The average age of people in Coalport was 42 years.
Income in Coalport
In 2000, the average income for a home in Coalport was $26,528 per year. For families, the average income was higher, at $40,833 per year.
Men generally earned more than women. The average income for each person in the borough was $16,232.
See also
 In Spanish: Coalport para niños
 | James B. Knighten |
 | Azellia White |
 | Willa Brown |


