Kinsley, Kansas facts for kids
Quick facts for kids
Kinsley, Kansas
|
|
|---|---|
|
City and County seat
|
|
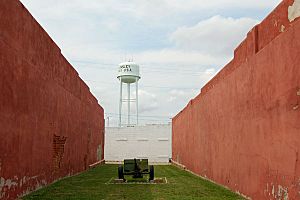
Water tower (2008)
|
|
|
|
|
|
| Country | United States |
| State | Kansas |
| County | Edwards |
| Founded | 1870s |
| Platted | 1873 |
| Incorporated | 1878 |
| Named for | E.W. Kinsley |
| Area | |
| • Total | 1.30 sq mi (3.36 km2) |
| • Land | 1.30 sq mi (3.36 km2) |
| • Water | 0.00 sq mi (0.00 km2) |
| Elevation | 2,169 ft (661 m) |
| Population
(2020)
|
|
| • Total | 1,456 |
| • Density | 1,120/sq mi (433.3/km2) |
| Time zone | UTC-6 (CST) |
| • Summer (DST) | UTC-5 (CDT) |
| ZIP code |
67547
|
| Area code | 620 |
| FIPS code | 20-37075 |
| GNIS ID | 485603 |
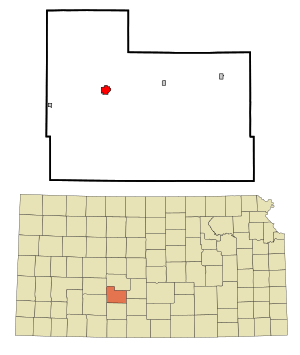
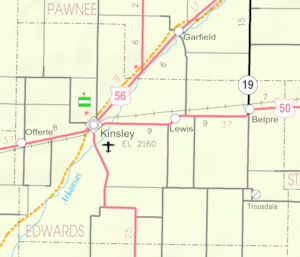
Kinsley is a city in Edwards County, Kansas, United States. It's also the main city, or county seat, of Edwards County. In 2020, about 1,456 people lived there. Kinsley is located right along Highway 50.
Contents
History of Kinsley
The area where Kinsley is now was first settled in 1873. It was originally called Petersburg. Later, its name was changed to Peter's City.
Many of the first people who moved here came from New England, especially Massachusetts. They were part of a group called the "New England colony." In 1873, the town was renamed Kinsley. It was named after Edward Wilkinson Kinsley, a businessman from Boston. He agreed to help build a church if the town took his name.
The first post office in Kinsley opened in April 1873. It was first called "Peters." In January 1874, the post office's name was changed to Kinsley, just like the town.
Geography and Climate
Kinsley is located in the state of Kansas. The city covers an area of about 1.29 square miles (3.34 square kilometers). All of this area is land.
Kinsley is about 35 miles (56 kilometers) east of Dodge City.
Kinsley's Climate
The weather in Kinsley has hot and humid summers. Winters are usually mild to cool. Kinsley has a type of climate known as a humid subtropical climate. This means it gets a good amount of rain throughout the year.
| Climate data for Kinsley, Kansas, 1991–2020 normals, extremes 1949–2009 | |||||||||||||
|---|---|---|---|---|---|---|---|---|---|---|---|---|---|
| Month | Jan | Feb | Mar | Apr | May | Jun | Jul | Aug | Sep | Oct | Nov | Dec | Year |
| Record high °F (°C) | 80 (27) |
88 (31) |
92 (33) |
99 (37) |
103 (39) |
110 (43) |
111 (44) |
110 (43) |
106 (41) |
98 (37) |
90 (32) |
85 (29) |
111 (44) |
| Mean maximum °F (°C) | — | — | — | — | — | — | — | — | — | 98 (37) |
90 (32) |
85 (29) |
98 (37) |
| Mean daily maximum °F (°C) | 45.9 (7.7) |
49.2 (9.6) |
59.5 (15.3) |
68.4 (20.2) |
77.6 (25.3) |
88.2 (31.2) |
92.7 (33.7) |
91.3 (32.9) |
83.3 (28.5) |
71.9 (22.2) |
58.3 (14.6) |
47.1 (8.4) |
69.4 (20.8) |
| Daily mean °F (°C) | 32.1 (0.1) |
35.4 (1.9) |
44.9 (7.2) |
53.9 (12.2) |
64.0 (17.8) |
74.5 (23.6) |
79.2 (26.2) |
77.9 (25.5) |
69.5 (20.8) |
56.8 (13.8) |
43.8 (6.6) |
33.6 (0.9) |
55.5 (13.1) |
| Mean daily minimum °F (°C) | 18.3 (−7.6) |
21.6 (−5.8) |
30.3 (−0.9) |
39.4 (4.1) |
50.3 (10.2) |
60.8 (16.0) |
65.7 (18.7) |
64.4 (18.0) |
55.7 (13.2) |
41.7 (5.4) |
29.3 (−1.5) |
20.2 (−6.6) |
41.5 (5.3) |
| Record low °F (°C) | −15 (−26) |
−18 (−28) |
−7 (−22) |
12 (−11) |
28 (−2) |
40 (4) |
46 (8) |
42 (6) |
21 (−6) |
14 (−10) |
−4 (−20) |
−19 (−28) |
−19 (−28) |
| Average precipitation inches (mm) | 0.62 (16) |
0.75 (19) |
1.78 (45) |
2.51 (64) |
3.75 (95) |
3.57 (91) |
3.85 (98) |
3.53 (90) |
2.13 (54) |
2.34 (59) |
0.97 (25) |
0.95 (24) |
26.75 (680) |
| Average snowfall inches (cm) | 4.7 (12) |
2.9 (7.4) |
3.1 (7.9) |
0.6 (1.5) |
0.0 (0.0) |
0.0 (0.0) |
0.0 (0.0) |
0.0 (0.0) |
0.0 (0.0) |
0.0 (0.0) |
0.5 (1.3) |
3.3 (8.4) |
15.1 (38.5) |
| Average precipitation days (≥ 0.01 in) | 2.3 | 3.0 | 4.1 | 6.2 | 6.3 | 7.3 | 7.0 | 6.0 | 4.8 | 4.6 | 3.0 | 3.2 | 57.8 |
| Average snowy days (≥ 0.1 in) | 1.5 | 1.2 | 0.9 | 0.3 | 0.0 | 0.0 | 0.0 | 0.0 | 0.0 | 0.1 | 0.3 | 1.2 | 5.5 |
| Source 1: NOAA | |||||||||||||
| Source 2: XMACIS2 | |||||||||||||
Fun Places to Visit
Kinsley has some interesting places to explore:
- Edwards County Historical Sod House and Museum: This museum shows what homes were like long ago. You can learn about the history of the area.
- Carnival Heritage Center & Museum: Located at 200 E 6th, this museum celebrates the history of carnivals.
- Half Way Sign: This unique sign tells you that Kinsley is exactly halfway between San Francisco and New York City. Both cities are 1,561 miles away!
People of Kinsley
| Historical population | |||
|---|---|---|---|
| Census | Pop. | %± | |
| 1880 | 457 | — | |
| 1890 | 771 | 68.7% | |
| 1900 | 780 | 1.2% | |
| 1910 | 1,547 | 98.3% | |
| 1920 | 1,986 | 28.4% | |
| 1930 | 2,270 | 14.3% | |
| 1940 | 2,178 | −4.1% | |
| 1950 | 2,479 | 13.8% | |
| 1960 | 2,263 | −8.7% | |
| 1970 | 2,212 | −2.3% | |
| 1980 | 2,074 | −6.2% | |
| 1990 | 1,875 | −9.6% | |
| 2000 | 1,658 | −11.6% | |
| 2010 | 1,457 | −12.1% | |
| 2020 | 1,456 | −0.1% | |
| U.S. Decennial Census | |||
2020 Census Information
In 2020, the census counted 1,456 people living in Kinsley. There were 660 households, which are groups of people living together. About 26.5% of these households had children under 18 years old.
The population included people of different backgrounds. About 83.38% were white. About 19.09% of the population identified as Hispanic or Latino.
The median age in Kinsley was 45.5 years. This means half the people were older and half were younger than 45.5. About 22.5% of the people were under 18 years old.
2010 Census Information
The census in 2010 showed that 1,457 people lived in Kinsley. There were 654 households. The average household had about 2.17 people.
About 26.6% of households had children under 18. Many households (46.5%) were married couples living together.
The median age in 2010 was 44.5 years. About 23.5% of Kinsley's residents were under 18 years old.
Education
Students in Kinsley attend schools in the Kinsley–Offerle USD 347 public school district.
Transportation
U.S. Route 50 is a major road that goes through Kinsley.
Famous People from Kinsley
Some well-known people have connections to Kinsley:
- Madge Blake (1899–1969), an actress famous for her role in the Batman TV show.
- Kyle Burkhart, a former professional football player.
- Freedy Johnston, a singer and songwriter.
- Peter Mehringer, who won a gold medal in freestyle wrestling at the 1932 Summer Olympics.
- Earl Winfield Spencer Jr., who was the first commanding officer of Naval Air Station in San Diego, California. He was also the first husband of Wallis, Duchess of Windsor.
See also
 In Spanish: Kinsley (Kansas) para niños
 | Valerie Thomas |
 | Frederick McKinley Jones |
 | George Edward Alcorn Jr. |
 | Thomas Mensah |

