List of districts in Northern Ireland by national identity facts for kids
This article is about how people in Northern Ireland described their national identity in 2011. Every ten years, the UK Census asks people questions about themselves. In 2011, for the first time, people in Northern Ireland were asked: "How would you describe your national identity?" They could choose from a list, including British, Irish, and Northern Irish, and pick as many as they felt applied to them.
Many people in Northern Ireland feel a strong connection to either a British or Irish identity. Some also feel a strong Northern Irish identity. The census results help us understand these different feelings across the region.
Contents
Who Feels Irish?
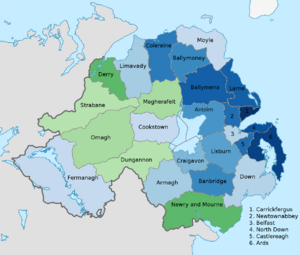
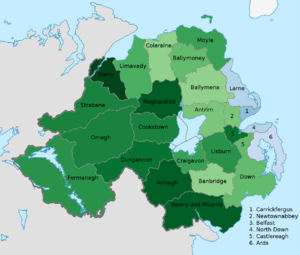
In 2011, more people in two areas, Derry and Newry, said they felt Irish. In Derry, about 55% of people felt Irish, and in Newry, about 52% did. It's interesting to note that while many people in Northern Ireland are Catholic (about 45%), fewer (around 28%) described their national identity as Irish. This shows that not all Catholics identify as Irish. For example, in the Larne Borough Council area, only about 10% of people felt Irish, even though about 25% were Catholic.
Who Feels British?
British national identity was the most common in eleven of the districts. About 48% of people in Northern Ireland said they felt British. This number is very similar to the number of people who said they were from a Protestant background (also about 48%). However, this does not mean that all Protestants see themselves as mainly British. In some areas, more people identified as British than were Protestant. This suggests that some people who are not Protestant also identify as British.
Who Feels Northern Irish?
The feeling of being "Northern Irish" was spread out evenly across the region. It didn't seem to be strongly linked to a person's religion or community background. For example, the two areas with the highest number of people identifying as Northern Irish were Down (about 34%) and North Down (about 33%). Down is mostly Catholic, while North Down is mostly Protestant. This shows that people from different backgrounds can all feel Northern Irish.
Overall, in 20 of the 26 local areas, more people identified as British than Irish. In the other 6 areas, more people identified as Irish than British.
National Identity by Area
The table below shows how people in each of the original 26 local government districts described their national identity in the 2011 census. People could choose more than one identity.
| District | British | Irish | Northern Irish | English, Scottish or Welsh | All Other |
|---|---|---|---|---|---|
| Antrim | 55.2% | 20.1% | 30.4% | 2.3% | 3.9% |
| Ards | 73.6% | 7.5% | 31.9% | 1.9% | 1.5% |
| Armagh | 44.4% | 32.4% | 27.1% | 1.1% | 3.9% |
| Ballymena | 69.0% | 11.1% | 27.9% | 1.4% | 3.8% |
| Ballymoney | 60.6% | 16.4% | 30.9% | 1.7% | 1.7% |
| Banbridge | 61.1% | 16.2% | 31.8% | 1.5% | 1.8% |
| Belfast | 43.2% | 34.8% | 26.8% | 1.5% | 5.1% |
| Carrickfergus | 76.5% | 5.3% | 30.3% | 2.1% | 1.8% |
| Castlereagh | 66.2% | 14.7% | 31.3% | 1.5% | 2.6% |
| Coleraine | 62.4% | 14.5% | 31.6% | 2.0% | 3.2% |
| Cookstown | 37.3% | 33.5% | 32.1% | 1.2% | 3.7% |
| Craigavon | 48.3% | 25.6% | 28.7% | 1.4% | 6.4% |
| Derry | 23.7% | 55.0% | 24.6% | 1.4% | 2.0% |
| Down | 40.2% | 32.2% | 34.1% | 1.9% | 2.0% |
| Dungannon and South Tyrone | 30.9% | 38.8% | 27.1% | 0.9% | 9.6% |
| Fermanagh | 37.2% | 36.1% | 29.5% | 1.7% | 3.1% |
| Larne | 69.8% | 10.1% | 31.4% | 2.1% | 1.2% |
| Limavady | 42.2% | 32.0% | 30.7% | 1.5% | 1.4% |
| Lisburn | 55.6% | 24.7% | 28.7% | 2.0% | 2.4% |
| Magherafelt | 31.4% | 42.7% | 29.8% | 1.0% | 2.8% |
| Moyle | 38.6% | 34.1% | 32.1% | 2.2% | 1.4% |
| Newry and Mourne | 20.2% | 53.0% | 27.6% | 1.2% | 4.3% |
| Newtownabbey | 66.5% | 13.4% | 31.2% | 1.3% | 2.4% |
| North Down | 71.1% | 9.1% | 33.0% | 3.0% | 2.4% |
| Omagh | 28.6% | 40.9% | 32.7% | 1.1% | 3.4% |
| Strabane | 33.0% | 39.2% | 31.8% | 1.4% | 1.3% |
New Local Areas in 2015
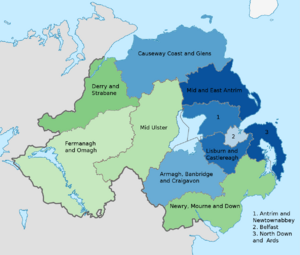
In 2015, the way local government worked in Northern Ireland changed. The 26 smaller districts were replaced by 11 larger "super districts." The first elections for these new areas happened in 2014. The table below shows how people identified themselves in these new, larger areas, based on the 2011 census data.
| District | British | Irish | Northern Irish | English, Scottish or Welsh | All Other |
|---|---|---|---|---|---|
| Antrim and Newtownabbey | 62.2% | 16.0% | 30.9% | 1.7% | 2.9% |
| Ards and North Down | 72.4% | 8.3% | 32.4% | 2.4% | 1.9% |
| Armagh, Banbridge and Craigavon | 50.5% | 25.2% | 28.9% | 1.3% | 4.6% |
| Belfast | 43.3% | 35.1% | 26.9% | 1.5% | 4.6% |
| Causeway Coast and Glens | 54.3% | 21.4% | 31.3% | 1.9% | 2.2% |
| Derry and Strabane | 26.2% | 50.8% | 26.5% | 1.4% | 1.8% |
| Fermanagh and Omagh | 33.3% | 38.3% | 31.0% | 1.4% | 3.2% |
| Lisburn and Castlereagh | 65.4% | 14.8% | 30.5% | 2.1% | 2.7% |
| Mid and East Antrim | 71.4% | 9.2% | 29.4% | 1.7% | 2.6% |
| Mid Ulster | 32.5% | 38.8% | 29.3% | 1.0% | 5.9% |
| Newry, Mourne and Down | 28.5% | 44.3% | 30.4% | 1.5% | 3.3% |
See also
- Demography of Northern Ireland
- Local Councils in Northern Ireland
- List of districts in Northern Ireland by population
- List of districts in Northern Ireland by area
- List of districts in Northern Ireland by religion or religion brought up in
- Census in the United Kingdom
- British people
- Irish people
- Northern Irish people
- Ulster Scots people
 | James Van Der Zee |
 | Alma Thomas |
 | Ellis Wilson |
 | Margaret Taylor-Burroughs |


