
Monmouth, Oregon facts for kids
Quick facts for kids
Monmouth, Oregon
|
|
|---|---|

Main Street looking east
|
|

Location in Oregon
|
|

Monmouth, Oregon
Location in the United States
|
|
| Country | United States |
| State | Oregon |
| County | Polk |
| Incorporated | 1859 |
| Area | |
| • Total | 2.33 sq mi (6.04 km2) |
| • Land | 2.25 sq mi (5.82 km2) |
| • Water | 0.08 sq mi (0.21 km2) |
| Elevation | 207 ft (63 m) |
| Population
(2020)
|
|
| • Total | 11,110 |
| • Density | 4,939.97/sq mi (1,907.59/km2) |
| Time zone | UTC-8 (Pacific) |
| • Summer (DST) | UTC-7 (Pacific) |
| ZIP code |
97361
|
| Area code(s) | 503 |
| FIPS code | 41-49550 |
| GNIS feature ID | 2411134 |
| Website | www.ci.monmouth.or.us |
Monmouth is a city in Polk County, Oregon. It was named after Monmouth, Illinois, because its first settlers came from there. In 2020, about 11,110 people lived in Monmouth. It is part of the Salem Metropolitan Statistical Area.
Contents
History of Monmouth
Monmouth was founded in 1853 by a group of pioneers. They set aside 640 acres (2.6 km2) to build a city and a college. This college was meant to be run by the Christian Church. Money from selling these lands helped start Monmouth University, which is now called Western Oregon University.
For many years, Monmouth was a "dry town." This meant that selling alcoholic drinks in stores, restaurants, and bars was not allowed. Monmouth was the last dry town in Oregon. This rule ended in November 2002, when people voted to allow alcohol sales.
Why Monmouth Was a Dry Town
Elijah Davidson and his family settled Monmouth. Davidson was a strong supporter of not allowing alcohol. In 1850, he and his family traveled to Oregon Territory. By 1854, many more families from the Christian Church in Monmouth, Illinois, joined them. Many of these families were related to Davidson.
In February 1859, Davidson and other leaders worked to ban alcohol in Monmouth. They wanted to stop alcohol from being brought in, sold, or consumed. One main reason they gave was to make the town safer and better. They believed it would help keep people and property secure.
Even though some business owners tried to change the alcohol ban over the years, they did not succeed. The local religious community felt it was important to keep the ban for the good of the town. People who wanted to end the ban argued that it was bad for business. They also said it made Monmouth unique.
Over time, fewer people supported the alcohol ban. Some people felt it was hurting the town's growth and property values. Those who wanted to keep the ban argued against it. There was even a rumor that the land given for the university would go back to the original owners if the ban ended. This would cost the state a lot of money to buy it back.
In the early 1970s, a vote to end the ban failed by a large margin. But in November 2002, voters finally approved ending the ban. This made Monmouth no longer the last dry town on the West Coast.
Geography of Monmouth
Monmouth is about 12 miles (19 km) west of Salem. It is located on Oregon Route 99W. The city is in the area drained by Ash Creek, which is a little west of the Willamette River.
The United States Census Bureau says that Monmouth covers a total area of 2.24 square miles (5.80 km2). All of this area is land.
Population Information

| Historical population | |||
|---|---|---|---|
| Census | Pop. | %± | |
| 1880 | 267 | — | |
| 1900 | 606 | — | |
| 1910 | 493 | −18.6% | |
| 1920 | 582 | 18.1% | |
| 1930 | 906 | 55.7% | |
| 1940 | 965 | 6.5% | |
| 1950 | 1,956 | 102.7% | |
| 1960 | 2,229 | 14.0% | |
| 1970 | 5,237 | 134.9% | |
| 1980 | 5,594 | 6.8% | |
| 1990 | 6,288 | 12.4% | |
| 2000 | 7,741 | 23.1% | |
| 2010 | 9,534 | 23.2% | |
| 2020 | 11,110 | 16.5% | |
| Sources: U.S. Decennial Census 2020 |
|||
Monmouth's Population in 2010
In 2010, there were 9,534 people living in Monmouth. There were 3,247 households and 1,769 families. The city had about 4,256 people per square mile (1,643 per km2). There were 3,450 homes, with about 1,540 homes per square mile (595 per km2).
Most of the people in Monmouth were White (82.8%). Other groups included African American (1.1%), Native American (1.5%), Asian (3.3%), and Pacific Islander (0.6%). About 6.6% were from other races, and 4.1% were from two or more races. People of Hispanic or Latino background made up 13.4% of the population.
Out of the 3,247 households, 26.8% had children under 18. About 41.8% were married couples. About 9.4% were single mothers, and 3.3% were single fathers. About 45.5% were not families. Around 23.9% of households had only one person living there. About 7.5% had someone aged 65 or older living alone. The average household had 2.52 people, and the average family had 3.07 people.
The average age in Monmouth was 23.7 years. About 18.2% of residents were under 18. A large group, 34.9%, were between 18 and 24 years old. About 20.8% were 25 to 44 years old. Around 16.8% were 45 to 64 years old, and 9.4% were 65 or older. The population was 47.9% male and 52.1% female.
Education in Monmouth
Monmouth is part of the Central School District. It is also home to Western Oregon University. Ash Creek Elementary School and Monmouth Elementary School are in Monmouth. Independence Elementary School, Talmadge Middle School, and Central High School are in the nearby city of Independence.
Images for kids
-
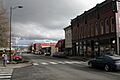
Main Street looking east
-
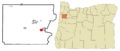
Location in Oregon
See also
 In Spanish: Monmouth (Oregón) para niños
