National debt of the United States facts for kids
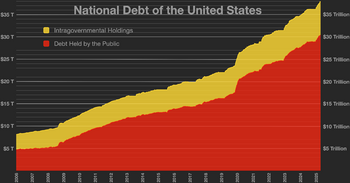
The national debt of the United States is the total amount of money the U.S. government owes. It's like when you borrow money from friends or family, but on a much bigger scale! This debt comes from selling special government bonds and other securities to people, companies, and even other countries.
When the government spends more money than it collects in taxes, it creates a "deficit." This means the national debt goes up because the government has to borrow more. If the government collects more money than it spends, it has a "surplus," and the debt can go down.
The national debt has two main parts:
- Debt held by the public: This is money owed to people, companies, the Federal Reserve, and foreign governments who bought U.S. government bonds.
- Debt held by government accounts: This is money the government owes to its own programs, like the Social Security Trust Fund. It's like the government borrowing from itself.
As of December 2023, the total federal debt was about $33.1 trillion. A big part of this, $26.5 trillion, was debt held by the public. The rest, $12.1 trillion, was intragovernmental debt. The cost of paying interest on this debt was about $726 billion in July 2023. This was about 14% of all federal spending.
The amount of debt compared to the country's total economic output, called debt-to-GDP ratio, usually goes up during wars and tough economic times. It then tends to go down. However, experts predict the debt-to-GDP ratio will keep rising in the coming years. This is because interest costs and spending on programs like healthcare are growing faster than tax money and the economy.
Contents
History of the National Debt
The U.S. government has almost always had some national debt since it started in 1789. There was only one short time, around 1835–1836, when the nation completely paid off its debt during Andrew Jackson's presidency.
To compare debt over many years, people often look at it as a percentage of the country's total economic output (GDP).
Debt Changes Over Time
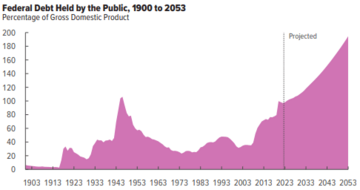
The U.S. public debt as a percentage of GDP was highest during and after World War II. It then dropped quickly until 1974. Since then, the debt as a share of GDP has generally increased. It only went down during the presidencies of Jimmy Carter and Bill Clinton.
Debt went up a lot in the 1980s when Ronald Reagan cut taxes and increased military spending. It fell in the 1990s due to less military spending, more taxes, and a strong economy. The debt rose sharply again during George W. Bush's presidency and after the 2007–2008 financial crisis. This was due to less tax money coming in and more spending, like economic relief programs.
In 2018, the federal budget deficit was about $782 billion. This was $116 billion more than in 2017. A big reason for this increase was a drop in corporate taxes after new tax laws were passed in 2017.
How Debt is Measured
The national debt is measured in different ways.
Public vs. Government Accounts
As of July 2020, the debt held by the public was $20.57 trillion. The money owed to government accounts was $5.94 trillion. This made the total debt $26.51 trillion.
The debt held by the public was about 77% of the U.S. GDP in 2017. This ranked the U.S. as having the 43rd highest debt-to-GDP ratio among 207 countries. Experts predict this ratio will rise to nearly 100% by 2028.
Understanding the Debt Burden
The "debt-to-GDP ratio" is a way to understand how big the debt is compared to the country's economy. It's calculated by dividing the debt by the GDP. If the economy grows faster than the debt, the ratio can go down. If the economy shrinks or the debt grows quickly, the ratio goes up.
For example, debt held by the public was 34.7% of GDP in 2000. It rose to 67.7% in 2011. If we include both public and intragovernmental debt, the total debt-to-GDP ratio was about 106% in April 2016.
How Annual Debt Changes Are Calculated
Normally, a yearly deficit should mean the national debt increases by that amount. However, it's a bit more complicated. Some government programs, like Social Security, are considered "off-budget." This means their money is counted separately.
For example, in 2008, the total deficit reported was $455 billion. But the actual increase in debt held by the public was $768 billion. This was because extra money was needed to help stabilize financial markets during a crisis. Also, the Social Security surplus, even though it's "off-budget," is borrowed and spent, which increases the "intragovernmental debt."
Who Owns the Debt?
Many different groups own parts of the U.S. national debt.
Less than half of the total national debt is owed to the Federal Reserve and other U.S. government accounts. The rest is held by various investors, including those from other countries.
Foreign Ownership
As of October 2018, foreign countries owned about $6.2 trillion of U.S. debt. This was about 39% of the debt held by the public. In December 2020, foreign entities held 33% of publicly held U.S. debt. The top three foreign holders were Japan, China, and the United Kingdom.
Historically, the share of debt held by foreign governments grew over time. However, in recent years, foreign ownership has gone down slightly. China's highest holding was in 2011, but it has since reduced its share.
Future Debt Predictions
Experts regularly predict how the national debt might change in the future.
Outlook Before COVID-19
In April 2018, the Congressional Budget Office (CBO) predicted that the budget deficit for fiscal year 2018 would be $804 billion. This was a big increase from the previous year. They also predicted that the total debt held by the public would rise from 78% of GDP in 2018 to 96% of GDP by 2028. This would be the highest level since World War II.
Outlook During COVID-19
The COVID-19 pandemic had a huge impact on the economy. The CBO estimated that the budget deficit for fiscal year 2020 would jump to $3.3 trillion, or 16% of GDP. This was more than triple the 2019 deficit and the largest percentage of GDP since 1945. They also predicted that debt held by the public would rise to 98% of GDP in 2020.
Long-Term Outlook
The CBO's long-term outlook, covering up to 2049, predicts that large budget deficits will push federal debt held by the public to very high levels. It could go from 78% of GDP in 2019 to 144% by 2049. This means the debt would be much higher than it is today.
The CBO also expects that spending on mandatory programs like Medicare and Social Security will continue to grow compared to GDP. Meanwhile, spending on other areas like defense might shrink.
Ways to Reduce Debt
There are different ideas on how to reduce the national debt.
Negative Real Interest Rates
Sometimes, the interest rate the government pays on its debt is lower than the rate of inflation. This is called a "negative real interest rate." When this happens, the debt becomes less of a burden over time. From the late 1940s to the early 1970s, the U.S. used this to reduce its debt burden significantly.
Risks and Debates About Debt
Rising debt levels can create several risks for the country.
CBO Risk Factors
The CBO has pointed out several risks related to high debt:
- More savings might go towards buying government debt instead of investing in businesses, which could slow down economic growth.
- If taxes need to be raised to pay interest costs, it could discourage saving and working.
- Rising interest costs might force cuts in other government programs.
- It could make it harder for the government to respond to future economic problems.
- There's a higher risk of a sudden financial crisis where investors demand much higher interest rates.
The Debt Ceiling
The United States debt ceiling is a legal limit on how much money the U.S. government can borrow. It means the government can't borrow more money to pay its existing bills if it hits this limit. This limit applies to almost all federal debt.
Sustainability of Debt
Experts worry about whether the federal government's spending and borrowing habits can continue in the long run. In 2009, the Government Accountability Office (GAO) said the U.S. was on an "unsustainable" path because of future increases in Medicare and Social Security spending.
Risks to Economic Growth
High debt levels might also affect how fast the economy grows. Some economists have suggested that very high debt could slow down economic growth. However, others argue that slow growth might actually cause debt to increase, rather than the other way around.
Former Federal Reserve Chairman Ben Bernanke said in 2010 that while there's no clear point where debt becomes dangerous, the U.S. should plan to reduce its deficits to safe levels over time.
Interest and Debt Service Costs
Paying interest on the national debt is a significant cost for the government. In fiscal year 2023, the interest expense on the public debt was about $678 billion. When you include interest owed to government trust funds, the total interest expense was $875 billion.
The CBO predicts that interest payments will increase significantly in the coming years. This is because both interest rates and the total amount of debt are expected to rise. Some studies even suggest that the U.S. government might spend more on debt interest than on national defense by 2024.
In October 2023, the interest rates on government bonds went up. This means it became more expensive for the government to borrow money. This also affected homebuyers and companies, who faced higher borrowing costs.
Recent Interest Payments
FY | GAO: (Total) Debt Service (in billion dollars) | FRED: (Total) Debt Service (in billion dollars) | GAO: (Publicly-held) Debt Service (in billion dollars) | FRED: Fed Receipts (in billion dollars) | FRED: Debt Service/Receipts |
---|---|---|---|---|---|
2023 | 875.5 | 981 | 678 | 4439 | 22% |
2022 | 723.6 | 829.6 | 496.5 | 4896 | 17% |
2021 | 575 | 612 | 392 | 4047 | 15% |
2020 | 527 | 517.7 | 371 | 3421 | 15% |
2019 | 574 | 564.5 | 404 | 3463 | 16% |
Chinese Holdings of U.S. Debt
Some people worry about how much U.S. government debt China holds. However, experts say that if China tried to use its holdings as a way to pressure the U.S., it would likely hurt China more than the U.S. If China sold off a lot of U.S. bonds, it would lower their value, making them less valuable for China.
Since 2018, China has been slowly reducing its holdings of U.S. debt. As of June 2020, Japan became the biggest foreign holder of U.S. debt, ahead of China.
Intergenerational Fairness
One debate about the national debt is about "intergenerational equity." This means thinking about whether one generation is benefiting from government spending and debt, and if that creates problems for future generations.
- When the government borrows money, it creates assets (like bonds) for investors. Future generations might inherit these assets.
- However, a small portion of the population owns most of these financial assets.
- If the debt is owed to foreign investors, the money paid back doesn't stay in the U.S.
- Higher debt means higher interest payments, which future taxpayers will have to pay through higher taxes or fewer government services.
- If borrowed money is used for good investments, like new roads or education, future generations could benefit.
Some economists argue that not investing enough in public projects and job creation today does more harm to future generations than the debt itself.
COVID-19 Pandemic and Its Aftermath
The COVID-19 pandemic caused a huge economic impact starting in March 2020. Many businesses closed, and millions of people lost their jobs. This meant less tax money for the government and more spending on unemployment benefits and other support programs.
To help people and businesses, Congress passed the CARES Act in March 2020. This law included loans, grants, and direct payments to individuals. It was estimated to cost about $2.3 trillion. While it increased the deficit, it also helped prevent a complete economic collapse.
The CBO estimated that the CARES Act would increase federal deficits by about $1.8 trillion over the 2020-2030 period.
- This included a $988 billion increase in spending.
- A $446 billion decrease in tax money.
- A $326 billion increase in emergency spending.
The Committee for a Responsible Federal Budget estimated that the budget deficit for fiscal year 2020 would reach a record $3.8 trillion, or 18.7% of GDP. They also predicted that the national debt would reach 106% of U.S. GDP by September 2020, a record since World War II.
President Joe Biden also allocated a lot of money towards pandemic relief and other goals. Many economists believe this high level of spending contributed to the inflation spike from 2021 to 2022.