New Franklin, Missouri facts for kids
Quick facts for kids
New Franklin, Missouri
|
|
|---|---|

Location of New_Franklin, Missouri
|
|
| Country | United States |
| State | Missouri |
| County | Howard |
| Government | |
| • Type | Mayor-Alderman Government |
| Area | |
| • Total | 1.34 sq mi (3.46 km2) |
| • Land | 1.32 sq mi (3.43 km2) |
| • Water | 0.01 sq mi (0.03 km2) |
| Elevation | 646 ft (197 m) |
| Population
(2020)
|
|
| • Total | 1,027 |
| • Density | 775.09/sq mi (299.37/km2) |
| Time zone | UTC-6 (Central (CST)) |
| • Summer (DST) | UTC-5 (CDT) |
| ZIP code |
65274
|
| Area code(s) | 660 |
| FIPS code | 29-51824 |
| GNIS feature ID | 0723198 |
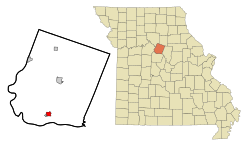
New Franklin is a city in Howard County, Missouri, United States. In 2020, about 1,027 people lived there. It is part of the larger Columbia Metropolitan Area.
The city is located a short distance northeast and uphill from an older town called Franklin. The original Franklin often flooded because it was near the river. It was also the starting point for the famous Santa Fe Trail, a historic trade route.
Contents
History
The first town of Franklin was started in 1816. But because it kept flooding, the people decided to move the town to higher ground. This move happened in 1826, and that's how New Franklin was created. The town was named after Benjamin Franklin, a very important person in American history.
New Franklin has several historic buildings that are listed on the National Register of Historic Places. These include the Harris-Chilton-Ruble House, the Thomas Hickman House, the New Franklin Commercial Historic District, and Rivercene. These places help tell the story of the area's past.
Geography
New Franklin is located at 39°0′58″N 92°44′18″W / 39.01611°N 92.73833°W. The city covers a total area of about 1.34 square miles (3.46 square kilometers). Most of this area is land, with only a very small part being water.
Climate
New Franklin experiences a climate with warm summers and cold winters. You can see more details about the weather in the table below.
| Climate data for New Franklin, Missouri (1991–2020 normals, extremes 1956–present) | |||||||||||||
|---|---|---|---|---|---|---|---|---|---|---|---|---|---|
| Month | Jan | Feb | Mar | Apr | May | Jun | Jul | Aug | Sep | Oct | Nov | Dec | Year |
| Record high °F (°C) | 75 (24) |
81 (27) |
85 (29) |
92 (33) |
94 (34) |
104 (40) |
109 (43) |
106 (41) |
101 (38) |
94 (34) |
83 (28) |
76 (24) |
109 (43) |
| Mean maximum °F (°C) | 62.4 (16.9) |
68.1 (20.1) |
77.7 (25.4) |
83.7 (28.7) |
87.9 (31.1) |
92.4 (33.6) |
96.3 (35.7) |
96.9 (36.1) |
91.8 (33.2) |
85.2 (29.6) |
74.0 (23.3) |
65.5 (18.6) |
98.4 (36.9) |
| Mean daily maximum °F (°C) | 37.8 (3.2) |
43.0 (6.1) |
54.4 (12.4) |
65.2 (18.4) |
74.6 (23.7) |
83.2 (28.4) |
87.2 (30.7) |
86.3 (30.2) |
79.0 (26.1) |
67.5 (19.7) |
54.0 (12.2) |
42.4 (5.8) |
64.5 (18.1) |
| Daily mean °F (°C) | 28.1 (−2.2) |
32.8 (0.4) |
43.4 (6.3) |
54.0 (12.2) |
64.3 (17.9) |
73.3 (22.9) |
77.2 (25.1) |
75.5 (24.2) |
67.5 (19.7) |
55.6 (13.1) |
43.6 (6.4) |
32.9 (0.5) |
54.0 (12.2) |
| Mean daily minimum °F (°C) | 18.3 (−7.6) |
22.6 (−5.2) |
32.4 (0.2) |
42.9 (6.1) |
54.0 (12.2) |
63.4 (17.4) |
67.1 (19.5) |
64.8 (18.2) |
55.9 (13.3) |
43.7 (6.5) |
33.1 (0.6) |
23.4 (−4.8) |
43.5 (6.4) |
| Mean minimum °F (°C) | −1.8 (−18.8) |
3.6 (−15.8) |
14.4 (−9.8) |
28.0 (−2.2) |
39.3 (4.1) |
51.2 (10.7) |
57.2 (14.0) |
55.2 (12.9) |
41.1 (5.1) |
29.0 (−1.7) |
16.2 (−8.8) |
5.7 (−14.6) |
−5.9 (−21.1) |
| Record low °F (°C) | −24 (−31) |
−21 (−29) |
−17 (−27) |
18 (−8) |
29 (−2) |
42 (6) |
48 (9) |
43 (6) |
31 (−1) |
22 (−6) |
−5 (−21) |
−22 (−30) |
−24 (−31) |
| Average precipitation inches (mm) | 1.98 (50) |
2.10 (53) |
2.93 (74) |
4.41 (112) |
4.87 (124) |
4.64 (118) |
4.39 (112) |
4.03 (102) |
4.10 (104) |
3.45 (88) |
2.70 (69) |
1.88 (48) |
41.48 (1,054) |
| Average snowfall inches (cm) | 2.9 (7.4) |
3.7 (9.4) |
0.7 (1.8) |
0.1 (0.25) |
0.0 (0.0) |
0.0 (0.0) |
0.0 (0.0) |
0.0 (0.0) |
0.0 (0.0) |
0.0 (0.0) |
0.5 (1.3) |
2.4 (6.1) |
10.3 (26) |
| Average precipitation days (≥ 0.01 in) | 7.3 | 7.2 | 9.1 | 11.1 | 12.4 | 10.3 | 9.0 | 8.6 | 8.0 | 9.0 | 7.6 | 7.3 | 106.9 |
| Average snowy days (≥ 0.1 in) | 1.5 | 2.0 | 0.5 | 0.1 | 0.0 | 0.0 | 0.0 | 0.0 | 0.0 | 0.0 | 0.4 | 1.3 | 5.8 |
| Source: NOAA | |||||||||||||
Demographics
| Historical population | |||
|---|---|---|---|
| Census | Pop. | %± | |
| 1870 | 227 | — | |
| 1880 | 250 | 10.1% | |
| 1890 | 132 | −47.2% | |
| 1900 | 1,156 | 775.8% | |
| 1910 | 794 | −31.3% | |
| 1920 | 848 | 6.8% | |
| 1930 | 1,210 | 42.7% | |
| 1940 | 1,144 | −5.5% | |
| 1950 | 1,060 | −7.3% | |
| 1960 | 1,096 | 3.4% | |
| 1970 | 1,122 | 2.4% | |
| 1980 | 1,228 | 9.4% | |
| 1990 | 1,107 | −9.9% | |
| 2000 | 1,145 | 3.4% | |
| 2010 | 1,089 | −4.9% | |
| 2020 | 1,027 | −5.7% | |
| U.S. Decennial Census | |||
Population in 2010
In 2010, there were 1,089 people living in New Franklin. These people lived in 496 households, and 292 of these were families. The average household had about 2.20 people.
The median age in the city was about 41.6 years old. This means half the people were older than 41.6 and half were younger. About 21.6% of the residents were under 18 years old.
Notable people
- Kit Carson – A famous explorer, guide, and frontiersman.
- Sara Evans – A well-known country music singer.
Notable place
New Franklin is home to a special part of the University of Missouri called the Center for Agroforestry. Agroforestry is a way of farming that mixes trees and shrubs with crops or livestock. The center holds a fun event every year called a chestnut roast.
See also
 In Spanish: New Franklin (Misuri) para niños
 | Tommie Smith |
 | Simone Manuel |
 | Shani Davis |
 | Simone Biles |
 | Alice Coachman |

