
New York's 1st congressional district facts for kids
Quick facts for kids New York's 1st congressional district |
|||
|---|---|---|---|
New York 's 1st congressional district - since January 3, 2013.
|
|||
| Representative |
|
||
| Distribution |
|
||
| Population (2019) | 713,168 | ||
| Median income | $101,701 | ||
| Ethnicity | |||
| Cook PVI | R+5 | ||
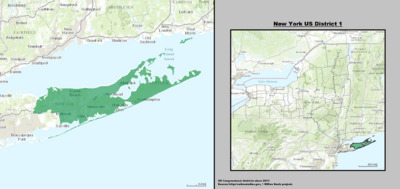
New York's 1st congressional district is a special area in New York State. It's located on Long Island. This district is important because the people who live here get to choose someone to represent them in the United States House of Representatives. This person speaks for them in the U.S. government.
For a while, people in this district often voted for a Democrat. But in 2014, Lee Zeldin, a Republican, was elected. He has been the representative for this district since then.
The district includes several towns and areas in Suffolk County. These are Smithtown, Brookhaven, Riverhead, Southold, Southampton, East Hampton, and Shelter Island. You might have heard of the Hamptons, which are very well-known and wealthy neighborhoods. They are also part of this district!
Contents
What is a Congressional District?
A congressional district is like a special neighborhood. It's drawn on a map so that people living there can elect one person. This person is called a "representative" or "congressperson." Their job is to go to Washington, D.C., and work in the United States House of Representatives. They make laws and decisions for the whole country. They also make sure the voices of the people in their district are heard.
Who Represents the District?
The person who represents New York's 1st congressional district is called a U.S. Representative. They are elected by the people living in the district. Their main job is to vote on laws and speak up for the needs of their community. They work with other representatives from all over the United States.
How People in the District Have Voted
People in New York's 1st congressional district vote for their representative. They also vote for the President of the United States. Looking at how they've voted in past presidential elections can show us how the district's political leanings have changed over time.
This table shows how the district voted in presidential elections:
| Year | Office | Results |
|---|---|---|
| 1992 | President | GHW Bush 40–38% |
| 1996 | President | B. Clinton 51–36% |
| 2000 | President | Gore 52–44% |
| 2004 | President | GW Bush 49–49% |
| 2008 | President | Obama 52–48% |
| 2012 | President | Obama 50–49% |
| 2016 | President | Trump 54–42% |
| 2020 | President | Trump 51–47% |
See also
 In Spanish: 1.º distrito congresional de Nueva York para niños
