Powell County, Kentucky facts for kids
Quick facts for kids
Powell County
|
|
|---|---|

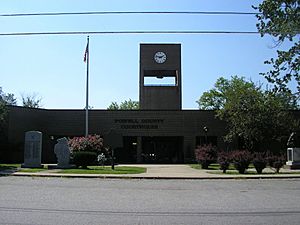
Powell County courthouse in Stanton
|
|

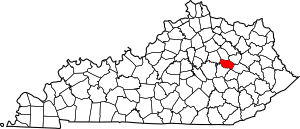
Location within the U.S. state of Kentucky
|
|
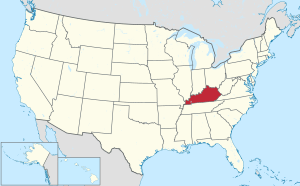
 Kentucky's location within the U.S. |
|
| Country | |
| State | |
| Founded | 1852 |
| Named for | Lazarus W. Powell |
| Seat | Stanton |
| Area | |
| • Total | 180 sq mi (500 km2) |
| • Land | 179 sq mi (460 km2) |
| • Water | 1.1 sq mi (3 km2) 0.6% |
| Population
(2020)
|
|
| • Total | 13,129 |
| • Estimate
(2023)
|
12,972 |
| • Density | 72.9/sq mi (28.2/km2) |
| Time zone | UTC−5 (Eastern) |
| • Summer (DST) | UTC−4 (EDT) |
| Congressional district | 6th |
Powell County is a county in the state of Kentucky, United States. It's a place with beautiful nature and a rich history. In 2020, about 13,129 people lived here.
The main town, or county seat, is Stanton. Powell County was created on January 7, 1852. It was named after Lazarus W. Powell, who was the Governor of Kentucky at that time. The county used to be a "dry county," meaning alcohol sales were restricted, but that changed in 2018.
Powell County is famous for its amazing natural spots. It's home to Natural Bridge State Resort Park and the Red River Gorge Geologic Area. These are popular places for ecotourism, where people visit to enjoy nature. You can also find the Pilot Knob State Nature Preserve here.
Contents
Exploring Powell County's Geography
Powell County covers a total area of about 180 square miles (470 km2) (square miles). Most of this area, about 179 square miles (460 km2), is land. Only a small part, about 1.1 square miles (2.8 km2), is water.
Neighboring Counties
Powell County shares its borders with several other counties:
- Montgomery County to the north
- Menifee County to the northeast
- Wolfe County to the southeast
- Lee County to the south
- Estill County to the southwest
- Clark County to the northwest
Protected Natural Areas
A part of the Daniel Boone National Forest is located within Powell County. This forest is a large protected area where people can enjoy outdoor activities like hiking and camping.
Population of Powell County
The number of people living in Powell County has changed over the years. Here's how the population has grown:
| Historical population | |||
|---|---|---|---|
| Census | Pop. | %± | |
| 1860 | 2,257 | — | |
| 1870 | 2,599 | 15.2% | |
| 1880 | 3,639 | 40.0% | |
| 1890 | 4,698 | 29.1% | |
| 1900 | 6,443 | 37.1% | |
| 1910 | 6,268 | −2.7% | |
| 1920 | 6,745 | 7.6% | |
| 1930 | 5,800 | −14.0% | |
| 1940 | 7,671 | 32.3% | |
| 1950 | 6,812 | −11.2% | |
| 1960 | 6,674 | −2.0% | |
| 1970 | 7,704 | 15.4% | |
| 1980 | 11,101 | 44.1% | |
| 1990 | 11,686 | 5.3% | |
| 2000 | 13,237 | 13.3% | |
| 2010 | 12,613 | −4.7% | |
| 2020 | 13,129 | 4.1% | |
| 2023 (est.) | 12,972 | 2.8% | |
| U.S. Decennial Census 1790-1960 1900-1990 1990-2000 2010-2020 |
|||
Natural Bridge State Resort Park
One of the biggest attractions in Powell County is Natural Bridge State Resort Park. This park is known for its amazing natural rock formations. It also has many signs of early Native American life, including shelters and burial grounds.
The main feature of the park is the Natural Bridge itself. This is a huge natural arch made of rock. It weighs more than 15 million pounds (6,800 t) (15 million pounds) and is 30 feet (9.1 m) wide at the top. At its base, it's about 85 feet (26 m) wide. This is just one of over 70 natural arches you can find in this area!
Towns and Communities
Powell County has a few towns and communities where people live.
Cities in Powell County
Unincorporated Community
- Slade (This is a smaller community that is not officially a city.)
See also
 In Spanish: Condado de Powell (Kentucky) para niños
 | Jackie Robinson |
 | Jack Johnson |
 | Althea Gibson |
 | Arthur Ashe |
 | Muhammad Ali |

