kids encyclopedia robot

Projections of population growth facts for kids

Kids Encyclopedia Facts

Population projections are like looking into a crystal ball to guess how many people will be on Earth in the future. These guesses help us understand how our growing population might affect our planet and everyone's well-being. Scientists use information about how people live, how many babies are born, and how long people live to make these predictions.

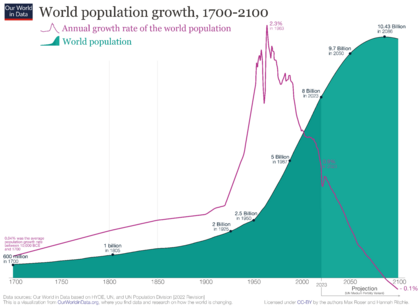
The United Nations (UN) keeps track of these numbers. In 1963, the world population grew very fast, by 2.3% each year. By 2023, this growth slowed down to 0.9%, which is about 74 million more people every year. The UN thinks the world population, which was 8 billion in 2023, might reach its highest point around 10.4 billion people in 2086. After that, it might slowly start to shrink. This prediction assumes that the number of babies born per woman will keep going down.

However, some other experts believe the population might peak earlier, around 2060-2070. This could happen if more people get educated and if family planning becomes more common, especially in developing countries.

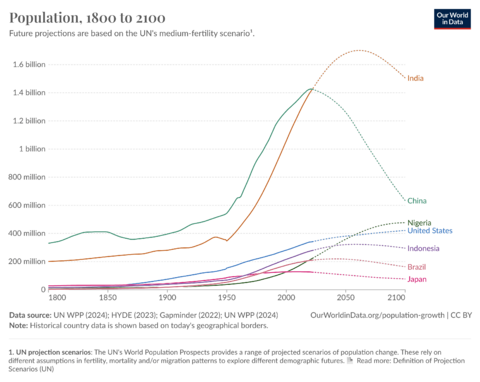
The UN also predicts that most of the world's population growth between 2020 and 2050 will happen in less developed countries, especially in sub-Saharan Africa. More than half of this growth will come from just eight countries, and five of them are in Africa. For example, the UN expects Nigeria to gain about 340 million people, which is almost the current population of the United States! On the other hand, China might lose almost half of its population. Even though fewer babies are being born globally, the world population will likely keep growing for a while because of something called population momentum. This means there are already many young people who will soon have families.

World population growth, 1700-2100, 2022 revision
World population growth 1700–2100, 2022 projection. This chart shows how the number of people on Earth has changed and how it might change in the future.

How Population Predictions Have Changed

Guessing future population numbers is tricky because birth rates and death rates can change. This means predictions have often been updated over time.

Predictions in the 21st Century

In the early 2000s, many thought the world population would stop growing around 2070. For example, in 2004, the UN predicted it would peak at 9.2 billion in 2075 and then stay around 9 billion until 2300.

But in 2012, the UN changed its mind. They then thought the population might not peak in the 21st century at all! They predicted it could reach 10.9 billion by 2100 and keep growing. The main reason for this change was that birth rates in Africa were not falling as quickly as expected.

However, the most recent UN report from 2022 changed the prediction again. Now, they expect the population to peak at 10.4 billion in the 2080s and then slowly start to decline. This new prediction is because birth rates in Africa are now falling faster than previously thought. For instance, the 2012 report thought Nigeria's population would reach 914 million by 2100, but the 2022 report lowered that to 546 million. This shows how much predictions can shift as new information comes in.

What Makes Populations Change?

The number of people in a country or area changes because of three main things: how many babies are born (fertility), how many people die (mortality), and how many people move in or out (migration).

Fertility

Total Fertility Rate Map by Country
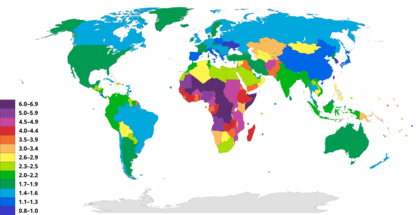
Map of countries by fertility rate (2023). This map shows how many children, on average, a woman has in different countries.

Fertility is measured by the total fertility rate (TFR). This is the average number of children a woman is expected to have in her lifetime. If people live longer and longer, the main thing that will affect future population growth is how the fertility rate changes.

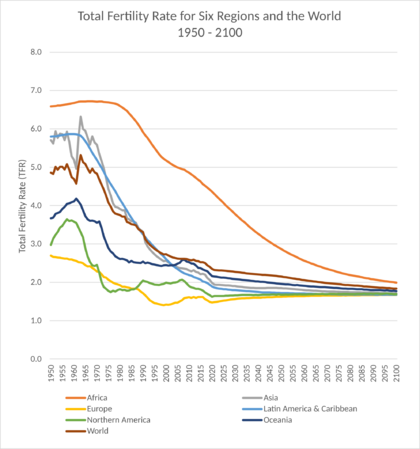
Globally, the average fertility rate was 2.5 children per woman between 2015 and 2020. This is about half of what it was in the 1950s (5 children per woman). The UN expects this rate to keep falling, reaching 1.8 by the year 2100.

Mortality

Mortality refers to death rates. If many people are dying and life expectancy (how long people are expected to live) is low, changes in death rates can greatly affect population growth. But if death rates are already low and people live a long time, then changes in mortality don't affect population growth as much.

Because fewer children are dying now, the average global life expectancy has gone up a lot. It was 48 years in the 1950s and is expected to reach 83 years by 2100. This means people are living much longer lives.

Migration

Migration is when people move from one country or area to another. This can also significantly change a population. For example, between 2010 and 2020, many countries saw a large number of people move in, often because they needed workers. Other countries saw many people leave, sometimes because of problems in their home country.

World Population Predictions

Let's look at how the world population is expected to change in the near future (up to 2050) and further into the future (up to 2100).

World Population Prospects
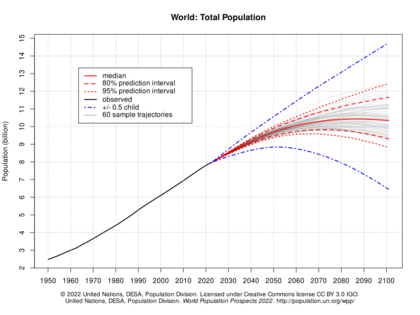
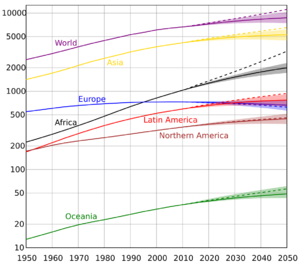
World population prospects, 2022 projection. This chart shows different possible paths for world population growth.

Up to 2050

The UN's 2022 report predicts the following populations for different parts of the world by 2050, compared to the year 2000:

Projected Regional Population (Billions)
2000 2050 Growth  %/yr
Asia 3.7 5.3 +43% +0.7%
Africa 0.8 2.5 +212% +2.3%
Europe 0.7 0.7 0% 0.0%
Latin America & the Caribbean 0.5 0.7 +40% +0.7%
Northern America 0.3 0.4 +33% +0.6%
Oceania 0.03 0.06 +100% +1.4%
World 6.1 9.7 +60% +0.9%

As you can see, Africa is expected to have the biggest population growth by far!

After 2050

Predictions for population changes after 2050 can vary a lot. This is because different organizations make different guesses about future birth rates, death rates, and migration.

The UN's 2022 report predicts that the world population will keep growing after 2050, but more slowly. It expects the population to reach its highest point at 10.4 billion in 2086, then slowly drop to about 10.3 billion by 2100. At that point, the world population might even start to shrink slightly.

Total Fertility Rate for 6 Regions and the World, 1950-2100, UN2022
Total Fertility Rate for Six Regions and the World, 1950-2100. This chart shows how the average number of children per woman has changed and is expected to change in different parts of the world.

Other groups have made different predictions. For example, one study from 2020 predicted that the world population would peak earlier, in 2064, at 9.7 billion, and then drop to 8.8 billion by 2100. This prediction assumes that women's rights will continue to improve globally, leading to fewer births.

Where Will Most Growth Happen?

From 2020 to 2050 and even beyond to 2100, most of the world's population growth is expected to happen in Africa. Out of the 1.9 billion additional people expected between 2020 and 2050, 1.2 billion will be in Africa. Asia will add 0.7 billion, and the rest of the world will have almost no growth.

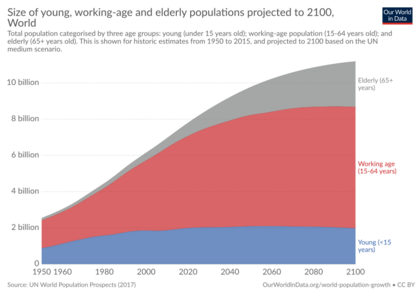
Africa's share of the global population is expected to grow from 17% in 2020 to 38% by 2100. Meanwhile, Asia's share will fall from 60% to 45%. This strong growth in Africa will happen because there are already many young people there who are starting to have families.

The table below shows how the yearly percentage changes in population are predicted to shift for different regions:

Projected Annual % Changes in Population
Region 2020–25

(%/yr)

2045–50

(%/yr)

2095–2100

(%/yr)

Africa 2.5 1.7 0.4
Asia 0.7 0.2 −0.4
Europe -0.1 −0.3 −0.3
Latin America & the Caribbean 0.7 0.2 −0.5
Northern America 0.5 0.2 0.1
Oceania 1.2 0.7 0.2
World 0.9 0.5 -0.1

The UN predicts that population growth will slow down in all regions between 2020 and 2100. By 2100, three regions will actually see their populations shrink, and the world as a whole will start to experience a global population decline.

Countries with the Most People by 2050 and 2100

The UN has also predicted how the populations of individual countries will change. In 2022, the world population reached 8 billion. The UN's 2022 report expects it to be around 9.7 billion in 2050 and about 10.3 billion by 2100.

The table below shows how the rankings of the most populated countries might change:

Projected Population Growth of the Top 14 Countries in 2024, 2050, and 2100
Country Population (millions) Rank
2024 2050 2100 2024 2050 2100
India 1,450 1,668 1,505 1 1 1
China 1,419 1,317 633 2 2 2
United States 345 380 421 3 3 6
Indonesia 283 320 295 4 6 8
Pakistan 251 371 511 5 4 3
Nigeria 232 359 476 6 5 4
Brazil 212 217 163 7 9 12
Bangladesh 173 214 208 8 10 10
Russia 144 136 126 9 13 17
Ethiopia 132 225 367 10 7 7
Mexico 130 148 130 11 12 15
Egypt 116 161 201 12 11 11
Democratic Republic of the Congo 109 218 430 13 8 5
Tanzania 68 129 262 14 14 9
Sudan 50 85 136 15 15 14
Angola 37 74 150 17 17 13
World 8,161 9,687 10,180

Between 2020 and 2050, about half of the world's population increase is expected to come from just eight countries: India, Nigeria, the Democratic Republic of the Congo, Pakistan, Ethiopia, Tanzania, Egypt, and Indonesia.

Future of Big Cities

Large cities are important places for jobs and new ideas. Currently, about 11% of the world's population lives in the 101 biggest cities. By the end of this century, this number could grow to 15% to 23%.

Here are some predictions for the populations of the largest cities in the future:

Projected Populations in Millions
Rank City Pop. 2025 City Pop. 2050 City Pop. 2075 City Pop. 2100
1 Japan Tokyo 36.40 India Mumbai 42.40 Democratic Republic of the Congo Kinshasa 58.42 Nigeria Lagos 88.30
2 India Mumbai 26.39 India Delhi 36.16 India Mumbai 57.86 Democratic Republic of the Congo Kinshasa 83.53
3 India Delhi 22.50 Bangladesh Dhaka 35.19 Nigeria Lagos 57.20 Tanzania Dar es Salaam 73.68
4 Bangladesh Dhaka 22.02 Democratic Republic of the Congo Kinshasa 35.00 India Delhi 49.34 India Mumbai 67.24
5 Brazil São Paulo 21.43 India Kolkata 33.04 Bangladesh Dhaka 46.22 India Delhi 57.33
6 Mexico Mexico City 21.01 Nigeria Lagos 32.63 India Kolkata 45.09 Sudan Khartoum 56.59
7 United States New York City 20.63 Japan Tokyo 32.62 Pakistan Karachi 43.37 Niger Niamey 56.15
8 India Kolkata 20.56 Pakistan Karachi 31.70 Tanzania Dar es Salaam 37.49 Bangladesh Dhaka 54.25
9 China Shanghai 19.41 United States New York City 24.77 Egypt Cairo 33.00 India Kolkata 52.40
10 Pakistan Karachi 19.10 Mexico Mexico City 24.33 Philippines Manila 32.75 Afghanistan Kabul 50.30
11 Democratic Republic of the Congo Kinshasa 16.76 Egypt Cairo 24.03 Afghanistan Kabul 32.67 Pakistan Karachi 49.06
12 Nigeria Lagos 15.80 Philippines Manila 23.55 Sudan Khartoum 30.68 Kenya Nairobi 46.66
13 Egypt Cairo 15.56 Brazil São Paulo 22.82 Japan Tokyo 28.92 Malawi Lilongwe 41.38
14 Philippines Manila 14.81 China Shanghai 21.32 Kenya Nairobi 28.42 Malawi Blantyre 40.91
15 China Beijing 14.55 Pakistan Lahore 17.45 United States New York City 27.92 Egypt Cairo 40.54
16 Argentina Buenos Aires 13.77 AfghanistanKabul 17.09 Iraq Baghdad 24.39 Uganda Kampala 40.14
17 United States Los Angeles 13.67 United States Los Angeles 16.42 Mexico Mexico City 24.18 Philippines Manila 39.96
18 Brazil Rio de Janeiro 13.41 India Chennai 16.28 Pakistan Lahore 23.88 Zambia Lusaka 37.74
19 Indonesia Jakarta 12.36 Sudan Khartoum 16.00 Ethiopia Addis Ababa 23.81 Somalia Mogadishu 36.37
20 Turkey Istanbul 12.10 Tanzania Dar es Salaam 15.97 India Chennai 22.21 Ethiopia Addis Ababa 35.82
21 China Guangzhou 11.84 China Beijing 15.97 India Bengaluru 21.31 Iraq Baghdad 34.10
22 Japan Osaka-Kobe 11.37 Indonesia Jakarta 15.92 Brazil São Paulo 21.28 United States New York City 30.19
23 Russia Moscow 10.53 India Bengaluru 15.62 China Shanghai 21.05 Chad N'Djamena 28.81
24 Pakistan Lahore 11.37 Argentina Buenos Aires 15.55 Niger Niamey 20.37 Nigeria Kano 28.28
25 China Shenzhen 10.20 Iraq Baghdad 15.09 Uganda Kampala 20.23 Yemen Sana'a 27.21
26 India Chennai 10.13 India Hyderabad 14.61 India Hyderabad 19.94 Pakistan Lahore 27.05
27 France Paris 10.04 Angola Luanda 14.30 Angola Luanda 19.65 India Chennai 25.81
28 United States Chicago 9.93 Brazil Rio de Janeiro 14.29 United States Los Angeles 18.51 Japan Tokyo 25.63
29 Iran Tehran 9.81 Kenya Nairobi 14.25 Nigeria Kano 17.69 India Bengaluru 24.77
30 South Korea Seoul 9.74 Turkey Istanbul 14.18 Indonesia Jakarta 17.55 Nigeria Ibadan 23.68
31 India Bengaluru 9.72 Ethiopia Addis Ababa 13.21 India Ahmedabad 16.93 Angola Luanda 23.55
32 Peru Lima 9.60 China Guangzhou 13.00 Yemen Sana'a 16.69 Mali Bamako 22.95
33 Colombia Bogotá 9.60 India Ahmedabad 12.43 Brazil Rio de Janeiro 16.56 Mexico Mexico City 22.22
34 China Wuhan 9.34 Bangladesh Chittagong 12.21 Argentina Buenos Aires 16.40 Senegal Dakar 21.18
35 China Tianjin 9.24 United States Chicago 11.93 Bangladesh Chittagong 16.04 Mozambique Maputo 21.07
36 India Hyderabad 9.09 Vietnam Ho Chi Minh City 11.86 Somalia Mogadishu 15.94 Burkina Faso Ouagadougou 20.63
37 United Kingdom London 8.62 Peru Lima 11.57 China Beijing 15.78 Madagascar Antananarivo 20.53
38 Thailand Bangkok 8.33 Colombia Bogotá 11.56 Ivory Coast Abidjan 15.52 United States Los Angeles 20.01
39 Hong Kong Hong Kong 8.31 China Shenzhen 11.20 Malawi Lilongwe 15.32 Brazil Rio de Janeiro 19.84
40 China Chongqing 8.28 France Paris 11.12 Malawi Blantyre 15.06 India Ahmedabad 19.71
41 Angola Luanda 8.24 Thailand Bangkok 11.08 India Pune 14.91 Ivory Coast Abidjan 19.70
42 Vietnam Ho Chi Minh City 8.15 Iran Tehran 11.00 Nigeria Ibadan 14.81 Brazil São Paulo 19.12
43 Iraq Baghdad 8.06 India Pune 10.92 Turkey Istanbul 14.68 Bangladesh Chittagong 18.82
44 Sudan Khartoum 7.94 Ivory Coast Abidjan 10.71 Senegal Dakar 14.56 Nigeria Abuja 18.58
45 India Ahmedabad 7.74 Nigeria Kano 10.44 Zambia Lusaka 14.52 Rwanda Kigali 18.30
46 Bangladesh Chittagong 7.64 China Wuhan 10.26 Chad N'djamena 14.48 Indonesia Jakarta 18.22
47 AfghanistanKabul 7.18 Russia Moscow 10.24 Vietnam Ho Chi Minh City 14.22 India Pune 17.32
48 Chile Santiago 7.03 Japan Osaka-Kobe 10.19 Mali Bamako 13.54 Guinea Conakry 17.32
49 India Pune 6.80 China Tianjin 10.15 United States Chicago 13.44 Argentina Buenos Aires 16.99
50 Vietnam Hanoi 6.75 Yemen Sana'a 10.05 China Guangzhou 12.84 China Beijing 15.58
51 Brazil Belo Horizonte 6.75 Vietnam Hanoi 9.83 Thailand Bangkok 12.55 Vietnam Ho Chi Minh City 15.53
52 Chile Santiago 6.31 United Kingdom London 9.75 India Surat 12.51 Turkey Istanbul 14.79
53 Saudi Arabia Riyadh 6.28 South Korea Seoul 9.47 Peru Lima 12.44 Egypt Alexandria 14.72
54 United States Miami 6.27 Hong Kong Hong Kong 9.47 Madagascar Antananarivo 12.40 Democratic Republic of the Congo Lubumbashi 14.66
55 China Dongguan 6.16 Uganda Kampala 9.43 Egypt Alexandria 11.99 United States Chicago 14.54
56 China Shenyang 6.16 India Surat 9.17 Colombia Bogota 11.89 India Surat 14.53
57 Ethiopia Addis Ababa 6.16 China Chongqing 9.09 Vietnam Hanoi 11.79 Democratic Republic of the Congo Mbuji-Mayi 14.20
58 United States Philadelphia 6.13 Nigeria Ibadan 8.75 Nigeria Abuja 11.75 Kenya Mombasa 14.01
59 Ivory Coast Abidjan 6.03 Egypt Alexandria 8.73 Burkina Faso Ouagadougou 11.70 Cambodia Phnom Penh 13.88
60 Canada Toronto 5.95 Senegal Dakar 8.52 France Paris 11.64 Nigeria Kaduna 13.20
61 Spain Madrid 5.94 Myanmar Yangon 8.44 China Shenzhen 11.06 Vietnam Hanoi 12.87
62 Kenya Nairobi 5.87 Saudi Arabia Riyadh 8.09 Mozambique Maputo 10.92 Peru Lima 12.81
63 Myanmar Yangon 5.87 Mali Bamako 7.63 Guinea Conakry 10.63 China Guangzhou 12.68
64 India Surat 5.70 United States Miami 7.53 Hong Kong Hong Kong 10.41 Thailand Bangkok 12.14
65 Tanzania Dar es Salaam 5.69 Chile Santiago 7.49 Iran Tehran 10.36 France Paris 11.86
66 Egypt Alexandria 5.65 India Kanpur 7.39 Myanmar Yangon 10.26 India Kanpur 11.73
67 Turkey Ankara 5.50 United States Philadelphia 7.36 China Wuhan 10.13 Yemen Al Hudaydah 11.51
68 United States DallasFort Worth 5.42 Madagascar Antananarivo 7.26 India Kanpur 10.09  Hong Kong 11.46
69 Mexico Tlaquepaque 5.37 Brazil Belo Horizonte 7.19 United Kingdom London 10.09 Morocco Casablanca 11.42
70 Mexico Tonalá 5.37 Pakistan Faisalabad 7.11 China Tianjin 10.03 Liberia Monrovia 11.21
71 Mexico Zapopan 5.37 Canada Toronto 7.04 Rwanda Kigali 9.79 Colombia Bogotá 11.20
72 China Chengdu 5.32 Nigeria Abuja 6.94 Pakistan Faisalabad 9.73 Nigeria Benin City 11.14
73 China Xi'an 5.23 India Jaipur 6.91 Democratic Republic of the Congo Lubumbashi 9.57 Egypt Giza 11.00
74 Spain Barcelona 5.18 Burkina Faso Ouagadougou 6.90 Russia Moscow 9.51 Pakistan Faisalabad 11.00
75 United States Atlanta 5.15 Niger Niamey 6.79 India Jaipur 9.43 Ghana Accra 10.99
76 China Guiyang 5.11 Chile Santiago 6.77 Democratic Republic of the Congo Mbuji-Mayi 9.27 India Jaipur 10.95
77 Singapore Singapore 5.10 China Dongguan 6.76 Japan Osaka-Kobe 9.03 China Shenzhen 10.92
78 Nigeria Kano 5.06 China Shenyang 6.76 Saudi Arabia Riyadh 9.00 Yemen Taiz 10.82
79 United States Houston 5.05 Somalia Mogadishu 6.57 China Chongqing 8.98 Togo Lomé 10.21
80 Mexico Guadalajara 4.97 Egypt Giza 6.52 Egypt Giza 8.96 India Lucknow 10.05
81 Mexico Guadalajara 4.97 Spain Madrid 6.52 Cambodia Phnom Penh 8.85 China Wuhan 10.00
82 Mexico Guadalupe 4.95 United States Dallas-Fort Worth 6.51 India Lucknow 8.65 China Tianjin 9.90
83 United States Washington, D.C. 4.89 India Lucknow 6.34 Kenya Mombasa 8.53 Cameroon Douala 9.68
84 Australia Sydney 4.83 Mexico Tlaquepaque 6.22 United States Miami 8.49 United Kingdom London 9.56
85 China Nanjing 4.77 Mexico Tonalá 6.22 United States Philadelphia 8.30 Saudi Arabia Riyadh 9.40
86 China Harbin 4.70 Mexico Zapopan 6.22 Nigeria Kaduna 8.26 Nigeria Port Harcourt 9.40
87 Brazil Porto Alegre 4.63 United States Atlanta 6.19 Ghana Accra 7.98 United States Miami 9.18
88 United States Detroit 4.61 Democratic Republic of the Congo Lubumbashi 6.15 India Nagpur 7.86 India Nagpur 9.13
89 India Kanpur 4.60 Guinea Conakry 6.14 Canada Toronto 7.81 United States Philadelphia 8.98
90 Brazil Brasilia 4.58 United States Houston 6.06 South Korea Seoul 7.67 Iraq Mosul 8.87
91 Algeria Algiers 4.50 United States Boston 6.04 Syria Aleppo 7.37 United States Dallas-Fort Worth 7.93
92 Russia St. Petersburg 4.48 Democratic Republic of the Congo Mbuji-Mayi 5.95 United States DallasFort Worth 7.34 Pakistan Rawalpindi 7.88
93 Mexico Monterrey 4.41 Ghana Accra 5.94 Togo Lomé 7.25 Russia Moscow 8.42
94 Yemen Sana'a 4.38 Syria Aleppo 5.90 Liberia Monrovia 7.08 Syria Aleppo 8.37
95 Brazil Recife 4.35 United States Washington, D.C. 5.87 Cameroon Douala 7.07 Canada Toronto 8.33
96 China Changchun 4.34 China Chengdu 5.84 Yemen Al-Hudaydah 7.06 India Patna 8.17
97 India Jaipur 4.30 Australia Sydney 5.82 India Patna 7.03 Iran Tehran 8.17
98 Pakistan Faisalabad 4.28 Mexico Guadalajara 5.76 Chile Santiago 6.98 Japan Osaka-Kobe 8.00
99 Australia Melbourne 4.24 India Nagpur 5.76 United States Atlanta 6.97 China Chongqing 8.87
100 Nigeria Ibadan 4.23 China Xi'an 5.75 Pakistan Rawalpindi 6.97 United States Dallas-Fort Worth 7.93
101 Senegal Dakar 4.23 Mexico Guadalupe 5.73 Nigeria Benin City 6.96 Pakistan Rawalpindi 7.88

Images for kids

kids search engine
Projections of population growth Facts for Kids. Kiddle Encyclopedia.