
Rome, Oregon facts for kids
Quick facts for kids
Rome, Oregon
|
|
|---|---|

Rome, Oregon
Location in Oregon

Rome, Oregon
Location in the United States
|
|
| Country | United States |
| State | Oregon |
| County | Malheur |
| Elevation | 3,386 ft (1,032 m) |
| Time zone | UTC−07:00 (Mountain (MST)) |
| • Summer (DST) | UTC−06:00 (MDT) |
| Area code(s) | 541 |
| GNIS feature ID | 1126268 |
| Coordinates and elevation from Geographic Names Information System | |
Rome, also known as Rome Station, is a small, undeveloped area in Oregon, United States. It's located in Malheur County, in the southeastern part of the state. Rome is found in the high desert, a very dry and open area.
You can find Rome just west of the Owyhee River on U.S. Route 95. It's about 12 miles (19 km) northeast of Burns Junction. A stream called Jordan Creek flows into the Owyhee River near Rome. This area is about 3,390 feet (1,033 meters) above sea level.
Contents
Why Is It Called Rome?
Rome got its name from William F. Stine. He thought the rock formations nearby looked like the old, ruined temples of Rome, Italy.
These amazing rock formations are called the Rome Cliffs. They are also known as the "Pillars of Rome." They are made of clay that contains fossils. The cliffs are about 100 feet (30 meters) tall. They stretch for about 5 miles (8 km) long and 2 miles (3 km) wide.
Mail Service in Rome
Rome used to have its own post office. It opened in 1909, and Leonard R. Duncan was the first person in charge. Today, people in Rome get their mail from Jordan Valley.
Did you know there was another place named Rome in Oregon a long time ago? It was in Marion County, near Woodburn. That Rome had a post office from 1851 to 1852.
Getting Around Rome
The Rome State Airport is located close to Rome. Besides the main U.S. Route 95, several other desert roads meet near Rome. These include the Old Idaho–Oregon–Nevada Highway, Rome Road, Skull Creek Road, and Indian Fort Creek Road.
Rome's Climate
Rome has a cold desert climate. This means it's usually very dry. It also has big differences between hot summers and cold winters.
| Climate data for Rome, Oregon, 1991–2020 normals, extremes 1950–present | |||||||||||||
|---|---|---|---|---|---|---|---|---|---|---|---|---|---|
| Month | Jan | Feb | Mar | Apr | May | Jun | Jul | Aug | Sep | Oct | Nov | Dec | Year |
| Record high °F (°C) | 67 (19) |
71 (22) |
81 (27) |
91 (33) |
100 (38) |
105 (41) |
110 (43) |
107 (42) |
106 (41) |
97 (36) |
78 (26) |
65 (18) |
110 (43) |
| Mean maximum °F (°C) | 55.6 (13.1) |
61.4 (16.3) |
72.8 (22.7) |
81.3 (27.4) |
90.1 (32.3) |
97.3 (36.3) |
103.4 (39.7) |
101.1 (38.4) |
95.5 (35.3) |
84.3 (29.1) |
68.9 (20.5) |
56.5 (13.6) |
103.8 (39.9) |
| Mean daily maximum °F (°C) | 41.1 (5.1) |
48.2 (9.0) |
57.7 (14.3) |
64.1 (17.8) |
73.3 (22.9) |
82.6 (28.1) |
93.4 (34.1) |
91.7 (33.2) |
82.2 (27.9) |
67.7 (19.8) |
51.5 (10.8) |
40.1 (4.5) |
66.1 (19.0) |
| Daily mean °F (°C) | 29.5 (−1.4) |
34.7 (1.5) |
41.5 (5.3) |
46.9 (8.3) |
55.4 (13.0) |
63.3 (17.4) |
71.8 (22.1) |
69.4 (20.8) |
60.2 (15.7) |
48.1 (8.9) |
36.7 (2.6) |
28.5 (−1.9) |
48.8 (9.4) |
| Mean daily minimum °F (°C) | 17.9 (−7.8) |
21.2 (−6.0) |
25.3 (−3.7) |
29.7 (−1.3) |
37.5 (3.1) |
44.0 (6.7) |
50.2 (10.1) |
47.1 (8.4) |
38.2 (3.4) |
28.5 (−1.9) |
21.9 (−5.6) |
17.0 (−8.3) |
31.5 (−0.2) |
| Mean minimum °F (°C) | 1.1 (−17.2) |
7.8 (−13.4) |
12.9 (−10.6) |
16.6 (−8.6) |
22.8 (−5.1) |
31.5 (−0.3) |
39.8 (4.3) |
37.0 (2.8) |
25.8 (−3.4) |
14.2 (−9.9) |
5.3 (−14.8) |
0.2 (−17.7) |
−6.4 (−21.3) |
| Record low °F (°C) | −31 (−35) |
−17 (−27) |
−4 (−20) |
9 (−13) |
13 (−11) |
14 (−10) |
19 (−7) |
28 (−2) |
15 (−9) |
−6 (−21) |
−11 (−24) |
−26 (−32) |
−31 (−35) |
| Average precipitation inches (mm) | 0.83 (21) |
0.65 (17) |
0.71 (18) |
1.05 (27) |
1.45 (37) |
1.00 (25) |
0.31 (7.9) |
0.21 (5.3) |
0.42 (11) |
0.73 (19) |
0.70 (18) |
0.89 (23) |
8.95 (229.2) |
| Average precipitation days (≥ 0.01 in) | 8.8 | 7.0 | 9.1 | 10.1 | 9.6 | 7.1 | 2.2 | 2.0 | 2.9 | 6.6 | 8.8 | 9.7 | 83.9 |
| Source 1: NOAA | |||||||||||||
| Source 2: National Weather Service(September record high) | |||||||||||||
Images for kids
-
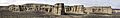
Pillars of Rome, a unique rock formation in southeastern Oregon.
