Quick facts for kids {{{Name}}}
[[{{{Type}}} constituency]] |
[[Image:{{{Map1}}}Constituency.svg|120px|]]
[[Image:England{{{Map2}}}.svg|120px|]] |
| {{{Name}}} shown within [[{{{Entity}}}]], and {{{Entity}}} shown within England |
| Created: |
{{{Year}}} |
| MP: |
{{{MP}}} |
| Party: |
{{{Party}}} |
| Type: |
House of Commons |
| County: |
[[{{{County}}}]] |
| EP constituency: |
[[{{{EP}}} (European Parliament constituency)|{{{EP}}}]] |
St. Pancras North was a special area in London, England. From 1885 to 1983, people living in this area voted for someone to represent them in the House of Commons. The House of Commons is a very important part of the UK Parliament, where laws are made.
The person elected was called a Member of Parliament (MP). They were chosen using a system called "first-past-the-post." This means the candidate who gets the most votes wins, even if they don't get more than half of all the votes. In 1983, the St. Pancras North area became part of a new voting area called Holborn and St Pancras.
What Was the St. Pancras North Area?
A "constituency" is like a special district drawn on a map. People living in that district vote for their MP. St. Pancras North was a "borough constituency," meaning it was an urban area.
How Did the Boundaries Change Over Time?
The exact borders of St. Pancras North changed a few times. These changes happened to make sure each MP represented a similar number of people.
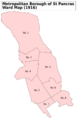
- 1918–1950: The area included specific parts of the Metropolitan Borough of St Pancras.
- 1950–1974: It covered more wards (smaller local areas) within the Metropolitan Borough of St Pancras.
- 1974–1983: The constituency was defined by wards within the London Borough of Camden, such as Camden, Chalk Farm, and Highgate.
Who Represented St. Pancras North?
Many different people served as the Member of Parliament for St. Pancras North. They belonged to various political parties, like the Liberal Party, the Conservative Party, and the Labour Party.
Here is a list of the MPs who represented St. Pancras North:
How Elections Worked in St. Pancras North
Elections are how people choose their representatives. In St. Pancras North, general elections happened regularly. Sometimes, if an MP left their job early, a "by-election" would be held to choose a new one.
Election Results: A Look at the Votes
The results below show how many votes each candidate received in different elections. This helps us see which parties were popular at different times.
1880s Elections
1890s Elections
Cochrane-Baillie became Lord Lamington, which meant he moved to the House of Lords. This led to a by-election.
| By-election 1890: St Pancras North |
| Party |
Candidate |
Votes |
% |
±% |
|
Liberal |
Thomas Henry Bolton |
2,657 |
50.7 |
+4.1 |
|
Conservative |
Henry Robert Graham |
2,549 |
48.7 |
−4.7 |
|
Independent |
John Leighton |
29 |
0.6 |
New |
| Majority |
108 |
2.0 |
N/A |
| Turnout |
5,235 |
82.7 |
+11.4 |
|
Liberal gain from Conservative |
Swing |
+4.4 |
|
1900s Elections
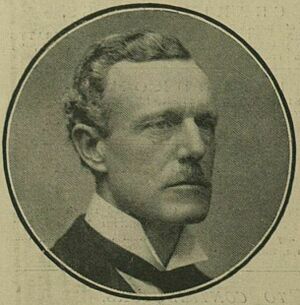
W.H. Dickinson was an MP for St. Pancras North.
1910s Elections
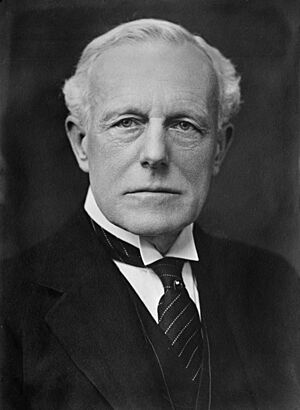
Sir Willoughby Dickinson, another MP for St. Pancras North.
1920s Elections
| General election 1922: St Pancras North |
| Party |
Candidate |
Votes |
% |
±% |
|
Unionist |
John Lorden |
9,156 |
37.7 |
-3.7 |
|
Labour |
John Gilbert Dale |
8,165 |
33.6 |
+7.0 |
|
Liberal |
Willoughby Dickinson |
6,979 |
28.7 |
-3.3 |
| Majority |
991 |
4.1 |
-5.3 |
| Turnout |
24,300 |
66.0 |
+14.1 |
|
Unionist hold |
Swing |
|
|
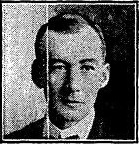
Henry Roome was a Liberal candidate.
| General election 1929: St Pancras North |
| Party |
Candidate |
Votes |
% |
±% |
|
Labour |
James Marley |
17,458 |
48.5 |
+4.4 |
|
Unionist |
Ian Fraser |
14,343 |
39.9 |
-6.8 |
|
Liberal |
Frederick L. Coysh |
4,177 |
11.6 |
+2.4 |
| Majority |
3,115 |
8.6 |
N/A |
| Turnout |
35,978 |
76.0 |
-3.2 |
|
Labour gain from Unionist |
Swing |
+5.6 |
|
1930s Elections
| General election 1931: St Pancras North |
| Party |
Candidate |
Votes |
% |
±% |
|
Conservative |
Ian Fraser |
22,490 |
63.9 |
+24.0 |
|
Labour |
James Marley |
12,257 |
34.8 |
-13.7 |
|
Communist |
W G Shepherd |
456 |
1.3 |
New |
| Majority |
10,233 |
29.1 |
N/A |
| Turnout |
35,203 |
73.4 |
-2.6 |
|
Conservative gain from Labour |
Swing |
|
|
| General election 1935: St Pancras North |
| Party |
Candidate |
Votes |
% |
±% |
|
Conservative |
Ian Fraser |
16,888 |
53.7 |
-10.2 |
|
Labour |
Henry Montague Tibbles |
13,287 |
42.3 |
+7.5 |
|
Liberal |
William Otterburn Hall |
1,259 |
4.0 |
New |
| Majority |
3,601 |
11.4 |
-17.7 |
| Turnout |
31,434 |
68.3 |
-5.1 |
|
Conservative hold |
Swing |
|
|
| By-election 1937: St Pancras North |
| Party |
Candidate |
Votes |
% |
±% |
|
Conservative |
Robert Grant-Ferris |
11,744 |
50.6 |
-3.1 |
|
Labour |
Henry Montague Tibbles |
11,476 |
49.4 |
+7.1 |
| Majority |
268 |
1.2 |
-10.2 |
| Turnout |
23,220 |
50.9 |
-13.4 |
|
Conservative hold |
Swing |
|
|
1940s Elections
| General election 1945: St Pancras North |
| Party |
Candidate |
Votes |
% |
±% |
|
Labour |
George House |
16,738 |
63.8 |
+21.5 |
|
Conservative |
Robert Grant-Ferris |
9,108 |
34.7 |
-19.0 |
|
Independent |
J.B. Gilmour |
403 |
1.5 |
New |
| Majority |
7,630 |
29.1 |
N/A |
| Turnout |
36,979 |
71.0 |
+2.7 |
|
Labour gain from Conservative |
Swing |
|
|
| By-election 1949: St Pancras North |
| Party |
Candidate |
Votes |
% |
±% |
|
Labour |
Kenneth Robinson |
16,185 |
57.5 |
-6.3 |
|
Conservative |
Neil Shields |
11,118 |
39.5 |
+4.8 |
|
Communist |
John Mahon |
854 |
3.0 |
New |
| Majority |
5,067 |
18.0 |
-10.9 |
| Turnout |
43,229 |
65.1 |
-5.9 |
|
Labour hold |
Swing |
|
|
1950s Elections
| General election 1951: St Pancras North |
| Party |
Candidate |
Votes |
% |
±% |
|
Labour |
Kenneth Robinson |
31,191 |
60.50 |
|
|
Conservative |
Charles A. B. Borrett |
20,362 |
39.50 |
|
| Majority |
10,829 |
21.00 |
|
| Turnout |
51,553 |
78.30 |
|
|
Labour hold |
Swing |
|
|
| General election 1955: St Pancras North |
| Party |
Candidate |
Votes |
% |
±% |
|
Labour |
Kenneth Robinson |
24,670 |
56.63 |
|
|
Conservative |
Anthony Royle |
17,588 |
40.38 |
|
|
Communist |
John Nicolson |
1,303 |
2.99 |
New |
| Majority |
7,082 |
16.25 |
|
| Turnout |
43,561 |
69.43 |
|
|
Labour hold |
Swing |
|
|
| General election 1959: St Pancras North |
| Party |
Candidate |
Votes |
% |
±% |
|
Labour |
Kenneth Robinson |
22,256 |
54.12 |
|
|
Conservative |
David Mitchell |
15,949 |
38.79 |
|
|
National Labour |
William Webster |
1,685 |
4.10 |
New |
|
Communist |
John Nicolson |
1,230 |
2.99 |
|
| Majority |
6,307 |
15.33 |
|
| Turnout |
41,120 |
69.47 |
|
|
Labour hold |
Swing |
|
|
1960s Elections
| General election 1964: St Pancras North |
| Party |
Candidate |
Votes |
% |
±% |
|
Labour |
Kenneth Robinson |
20,516 |
61.04 |
|
|
Conservative |
Kenneth Warren |
11,954 |
35.57 |
|
|
Communist |
John Nicolson |
1,140 |
3.39 |
|
| Majority |
8,562 |
25.47 |
|
| Turnout |
33,610 |
|
|
|
Labour hold |
Swing |
|
|
| General election 1966: St Pancras North |
| Party |
Candidate |
Votes |
% |
±% |
|
Labour |
Kenneth Robinson |
20,951 |
64.18 |
|
|
Conservative |
James Moorhouse |
10,440 |
31.98 |
|
|
Communist |
John Nicolson |
1,253 |
3.84 |
|
| Majority |
10,511 |
32.20 |
|
| Turnout |
32,644 |
|
|
|
Labour hold |
Swing |
|
|
1970s Elections
Images for kids
-
A map showing the wards of St Pancras Metropolitan Borough as they appeared in 1916.