2018 Mexican general election facts for kids
{{Infobox election | country = Mexico | flag_year = state
| module =
On July 1, 2018, Mexico held important general elections. People voted for a new President of Mexico, 128 members of the Senate, and 500 members of the Chamber of Deputies. This was one of the biggest election days in Mexico's history. Many states also held local elections for governors and other positions. Over 3,400 government jobs were decided that day.
The president at the time, Enrique Peña Nieto, could not run for president again. This is because of a rule that limits presidents to one six-year term. All members of the legislature were newly elected. This was the first time that lawmakers elected in this election could run for re-election later. The National Electoral Institute (INE) officially started the election process on September 8, 2017.
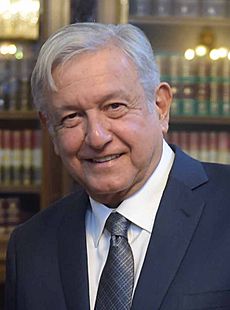
Andrés Manuel López Obrador from the National Regeneration Movement (MORENA) won the presidential election by a large margin. He was part of the Juntos Haremos Historia (Together We Will Make History) group. This was the first time since 1988 that a candidate won with more than half of all votes. It was also the first time a president was elected who was not from the Institutional Revolutionary Party (PRI) or its older versions since the Mexican Revolution. Also, for the first time, a group of parties (not including PRI) supporting one presidential candidate won most seats in both the Senate and Chamber of Deputies. This election was a big loss for the PRI. It was also the biggest defeat for a sitting Mexican government since 1917.
Contents
|
||||||||||||||||||||||||||||||||||||||||||||||||||||||||||||||||||||||||||||||||||||||||||||||||||||||||||
| Turnout | 63.43% | |||||||||||||||||||||||||||||||||||||||||||||||||||||||||||||||||||||||||||||||||||||||||||||||||||||||||
|---|---|---|---|---|---|---|---|---|---|---|---|---|---|---|---|---|---|---|---|---|---|---|---|---|---|---|---|---|---|---|---|---|---|---|---|---|---|---|---|---|---|---|---|---|---|---|---|---|---|---|---|---|---|---|---|---|---|---|---|---|---|---|---|---|---|---|---|---|---|---|---|---|---|---|---|---|---|---|---|---|---|---|---|---|---|---|---|---|---|---|---|---|---|---|---|---|---|---|---|---|---|---|---|---|---|---|
|
||||||||||||||||||||||||||||||||||||||||||||||||||||||||||||||||||||||||||||||||||||||||||||||||||||||||||
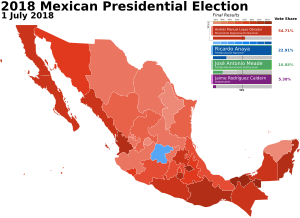
States won by candidate
|
||||||||||||||||||||||||||||||||||||||||||||||||||||||||||||||||||||||||||||||||||||||||||||||||||||||||||
|
||||||||||||||||||||||||||||||||||||||||||||||||||||||||||||||||||||||||||||||||||||||||||||||||||||||||||
|
Legislative election
|
||||||||||||||||||||||||||||||||||||||||||||||||||||||||||||||||||||||||||||||||||||||||||||||||||||||||||
|
|
||||||||||||||||||||||||||||||||||||||||||||||||||||||||||||||||||||||||||||||||||||||||||||||||||||||||||
|
|
||||||||||||||||||||||||||||||||||||||||||||||||||||||||||||||||||||||||||||||||||||||||||||||||||||||||||
|
All 500 seats in the Chamber of Deputies All 128 seats in the Senate of the Republic |
||||||||||||||||||||||||||||||||||||||||||||||||||||||||||||||||||||||||||||||||||||||||||||||||||||||||||
This lists parties that won seats. See the complete results below.
|
||||||||||||||||||||||||||||||||||||||||||||||||||||||||||||||||||||||||||||||||||||||||||||||||||||||||||
- The Por México al Frente Group
- The Todos por México Group
- The Juntos Haremos Historia Group
- Independent Candidates
- Presidential Election Results
- Senate Election Results
- Chamber of Deputies Election Results
- Governorship Elections
How Mexico's Elections Work
This section explains how people vote for leaders in Mexico.
Electing the President
The president of Mexico is chosen by a simple vote. The candidate who gets the most votes wins. This is called a plurality system.
Electing the Chamber of Deputies
The Chamber of Deputies has 500 members. They serve for three years.
- 300 members are elected from specific areas. The person with the most votes in that area wins. This is called first-past-the-post voting.
- The other 200 members are chosen based on proportional representation. This means seats are given out based on the percentage of votes parties get.
No single party can hold more than 300 seats. Members can serve up to four terms in a row.
Electing the Senate
The Senate has 128 members. They serve for six years, just like the president.
- 96 senators are elected from 32 areas, with three members from each area. The party with the most votes gets two seats. The party with the second most votes gets one seat.
- The other 32 senators are chosen based on proportional representation from a single national list.
Senators can serve up to two terms.
Who Ran for President?
Many people wanted to be president in 2018. They formed different groups or ran on their own.
The Por México al Frente Group
Por México al Frente means "For Mexico to the Front." This group was made up of:
- The National Action Party (PAN)
- The Party of the Democratic Revolution (PRD)
- The Citizens' Movement
These parties joined together to try and win against the ruling PRI party and Andrés Manuel López Obrador.
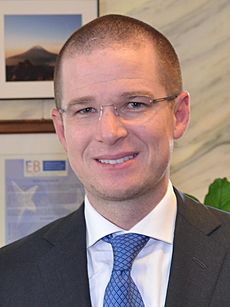
Ricardo Anaya Cortés, who was the leader of the PAN, became the candidate for this group.
The Todos por México Group
Todos por México means "Everyone for Mexico." This group included:
- The Institutional Revolutionary Party (PRI)
- The Ecologist Green Party of Mexico (PVEM)
- The New Alliance Party (PANAL)
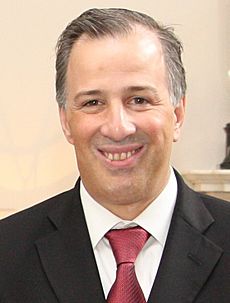
The PRI changed its rules to allow someone who wasn't a long-time member to be their candidate. This helped José Antonio Meade Kuribreña. He was a government official but not a PRI member. He became their presidential candidate.
The Juntos Haremos Historia Group
Juntos Haremos Historia means "Together We Will Make History." This group included:
- The National Regeneration Movement (MORENA)
- The Labor Party (PT)
- The Social Encounter Party (PES)
Andrés Manuel López Obrador was the candidate for this group. This was his third time running for president. He had run twice before with a different party. After the 2012 election, he started MORENA. This was MORENA's first time running in a presidential election.
Independent Candidates
For the first time in Mexico's modern history, people could run for president without being part of a political party.
- Margarita Zavala, a lawyer and former first lady, tried to run as an independent. She later decided to stop her campaign.
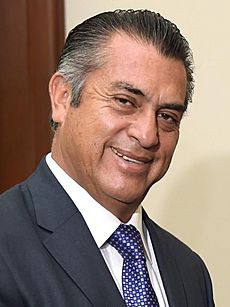
- Jaime Rodríguez Calderón, who was the governor of Nuevo León, also ran as an independent.
Campaign Promises and Ideas
During the election, candidates made many promises to the voters.
López Obrador's Promises
- He promised to end special benefits for former presidents, like their lifelong pensions. He said this money would be used to help older citizens.
- He also promised to stop the gasolinazos, which were increases in fuel prices. He planned to build new fuel refineries in Mexico. This would allow Mexico to process more of its own oil into gasoline, making it cheaper.
- López Obrador also said he would investigate past presidents.
Anaya's Promises
- Ricardo Anaya promised to give a basic income to all Mexican citizens. This means everyone would get a certain amount of money regularly.
- He also promised to investigate the current president, Enrique Peña Nieto.
Meade's Ideas
- José Antonio Meade supported the energy reforms made by the previous president. He said he would continue them if he won.
- He proposed creating a "Unique Register of the Necessities of Each Person." This idea was met with some jokes online.
Rodríguez Calderón's Ideas
- Jaime Rodríguez Calderón suggested very strict punishments for people who misuse public money.
- He also proposed bringing back the death penalty for certain serious crimes.
Election Results
On July 1, 2018, Andrés Manuel López Obrador won the presidential election. He received over 50% of the votes. He won in 30 out of 31 states and Mexico City. This was the most states won by a candidate since 1994.
Shortly after the polls closed, José Antonio Meade and Ricardo Anaya both accepted their defeat. Jaime Rodríguez Calderón also recognized López Obrador's victory.
The official results showed that about 63% of eligible voters participated.
- López Obrador received about 53% of the votes.
- Anaya received about 22% of the votes.
- Meade received about 16% of the votes.
- Rodríguez Calderón received about 5% of the votes.
This was the first time since 1994 that a presidential candidate won with more than half of all votes.
Presidential Election Results
| Candidate | Party | Votes | % | |
|---|---|---|---|---|
| Andrés Manuel López Obrador | Juntos Haremos Historia (MORENA–PT–PES) | 30,113,483 | 54.71 | |
| Ricardo Anaya | Por México al Frente (PAN–PRD–MC) | 12,610,120 | 22.91 | |
| José Antonio Meade | Todos por México (PRI–PVEM–NA) | 9,289,853 | 16.88 | |
| Jaime Rodríguez Calderón | Independent | 2,961,732 | 5.38 | |
| Margarita Zavala | Independent | 32,743 | 0.06 | |
| Non-registered candidates | 31,982 | 0.06 | ||
| Total | 55,039,913 | 100.00 | ||
| Valid votes | 55,039,913 | 97.22 | ||
| Invalid/blank votes | 1,571,114 | 2.78 | ||
| Total votes | 56,611,027 | 100.00 | ||
| Registered voters/turnout | 89,250,881 | 63.43 | ||
| Source: INE | ||||
Senate Election Results
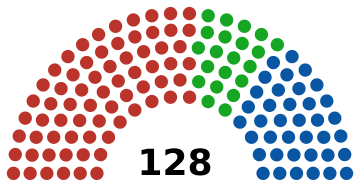 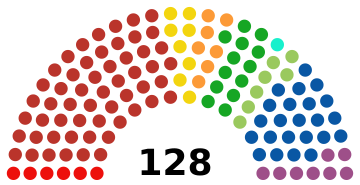 |
||||||||||
| Party or alliance | Party-list | Constituency | Total seats |
|||||||
|---|---|---|---|---|---|---|---|---|---|---|
| Votes | % | Seats | Votes | % | Seats | |||||
| Juntos Haremos Historia | Morena | 21,256,238 | 39.12 | 13 | 21,013,123 | 39.03 | 42 | 55 | ||
| Labor Party | 2,164,088 | 3.98 | 1 | 2,149,566 | 3.99 | 5 | 6 | |||
| Social Encounter Party | 1,320,283 | 2.43 | 0 | 1,311,337 | 2.44 | 8 | 8 | |||
| Total | 24,740,609 | 45.54 | 14 | 24,474,026 | 45.46 | 55 | 69 | |||
| Por México al Frente | National Action Party | 9,969,069 | 18.35 | 6 | 9,852,753 | 18.30 | 17 | 23 | ||
| Party of the Democratic Revolution | 2,982,826 | 5.49 | 2 | 2,973,479 | 5.52 | 6 | 8 | |||
| Citizens' Movement | 2,654,085 | 4.89 | 2 | 2,621,317 | 4.87 | 5 | 7 | |||
| Total | 15,605,980 | 28.72 | 10 | 15,447,549 | 28.70 | 28 | 38 | |||
| Todos por México | Institutional Revolutionary Party | 9,011,312 | 16.59 | 6 | 8,961,369 | 16.65 | 8 | 14 | ||
| Ecologist Green Party of Mexico | 2,527,710 | 4.65 | 2 | 2,514,578 | 4.67 | 4 | 6 | |||
| New Alliance Party | 1,306,792 | 2.41 | 0 | 1,299,733 | 2.41 | 1 | 1 | |||
| Total | 12,845,814 | 23.64 | 8 | 12,775,680 | 23.73 | 13 | 21 | |||
| Independents | 1,105,624 | 2.04 | 0 | 1,105,624 | 2.05 | 0 | 0 | |||
| Non-registered candidates | 31,812 | 0.06 | 0 | 30,526 | 0.06 | 0 | 0 | |||
| Total | 54,329,839 | 100.00 | 32 | 53,833,405 | 100.00 | 96 | 128 | |||
| Valid votes | 54,329,839 | 95.86 | 53,833,405 | 95.87 | ||||||
| Invalid/blank votes | 2,343,942 | 4.14 | 2,316,781 | 4.13 | ||||||
| Total votes | 56,673,781 | 100.00 | 56,150,186 | 100.00 | ||||||
| Source: Diario Oficial, Election Resources | ||||||||||
Chamber of Deputies Election Results
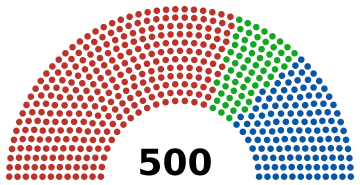 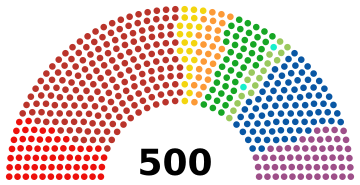 |
||||||||||
| Party or alliance | Party-list | Constituency | Total seats |
|||||||
|---|---|---|---|---|---|---|---|---|---|---|
| Votes | % | Seats | Votes | % | Seats | |||||
| Juntos Haremos Historia | Morena | 20,968,859 | 38.80 | 85 | 20,790,623 | 38.70 | 106 | 191 | ||
| Labor Party | 2,210,988 | 4.09 | 3 | 2,201,192 | 4.10 | 58 | 61 | |||
| Social Encounter Party | 1,353,499 | 2.50 | 0 | 1,347,540 | 2.51 | 56 | 56 | |||
| Total | 24,533,346 | 45.40 | 88 | 24,339,355 | 45.31 | 220 | 308 | |||
| Por México al Frente | National Action Party | 10,093,012 | 18.68 | 41 | 10,033,157 | 18.68 | 40 | 81 | ||
| Party of the Democratic Revolution | 2,967,452 | 5.49 | 12 | 2,959,800 | 5.51 | 9 | 21 | |||
| Citizens' Movement | 2,484,185 | 4.60 | 10 | 2,473,056 | 4.60 | 17 | 27 | |||
| Total | 15,544,649 | 28.76 | 63 | 15,466,013 | 28.79 | 66 | 129 | |||
| Todos por México | Institutional Revolutionary Party | 9,307,233 | 17.22 | 38 | 9,271,950 | 17.26 | 7 | 45 | ||
| Ecologist Green Party of Mexico | 2,694,654 | 4.99 | 11 | 2,685,677 | 5.00 | 5 | 16 | |||
| New Alliance Party | 1,390,882 | 2.57 | 0 | 1,385,421 | 2.58 | 2 | 2 | |||
| Total | 13,392,769 | 24.78 | 49 | 13,343,048 | 24.84 | 14 | 63 | |||
| Independents | 538,964 | 1.00 | 0 | 538,964 | 1.00 | 0 | 0 | |||
| Non-registered candidates | 32,938 | 0.06 | 0 | 32,611 | 0.06 | 0 | 0 | |||
| Total | 54,042,666 | 100.00 | 200 | 53,719,991 | 100.00 | 300 | 500 | |||
| Valid votes | 54,042,666 | 96.02 | 53,719,991 | 96.02 | ||||||
| Invalid/blank votes | 2,241,811 | 3.98 | 2,226,781 | 3.98 | ||||||
| Total votes | 56,284,477 | 100.00 | 55,946,772 | 100.00 | ||||||
| Source: Diario Oficial, Election Resources | ||||||||||
Governorship Elections
Many states also held elections for governor on the same day. Here are some of the results:
Mexico City Governor Election
| Candidate | Party | Votes | % | |
|---|---|---|---|---|
| Claudia Sheinbaum Pardo | Morena | 2,537,454 | 48.17 | |
| Alejandra Barrales | Party of the Democratic Revolution | 1,673,015 | 31.76 | |
| Mikel Arriola Peñalosa | Institutional Revolutionary Party | 691,772 | 13.13 | |
| Mariana Boy Tamborrell | Ecologist Green Party of Mexico | 206,942 | 3.93 | |
| Lorena Osornio | Independent | 64,591 | 1.23 | |
| Marco Rascón | Humanist Party | 51,676 | 0.98 | |
| Purificación Carpinteyro Calderón | New Alliance Party | 36,105 | 0.69 | |
| Non-registered candidates | 5,727 | 0.11 | ||
| Total | 5,267,282 | 100.00 | ||
| Valid votes | 5,267,282 | 97.67 | ||
| Invalid/blank votes | 125,605 | 2.33 | ||
| Total votes | 5,392,887 | 100.00 | ||
| Registered voters/turnout | 7,628,256 | 70.70 | ||
| Source: IECM | ||||
Chiapas Governor Election
| Candidate | Party | Votes | % | |
|---|---|---|---|---|
| Rutilio Escandón | Morena | 922,310 | 41.69 | |
| Fernando Castellanos | Ecologist Green Party of Mexico | 529,508 | 23.93 | |
| Roberto Albores Gleason | Institutional Revolutionary Party | 474,122 | 21.43 | |
| José Antonio Aguilar Bodegas | National Action Party | 220,675 | 9.97 | |
| Jesús Alejo Orantes Ruiz | Independent | 62,611 | 2.83 | |
| Non-registered candidates | 3,309 | 0.15 | ||
| Total | 2,212,535 | 100.00 | ||
| Valid votes | 2,212,535 | 94.17 | ||
| Invalid/blank votes | 136,992 | 5.83 | ||
| Total votes | 2,349,527 | 100.00 | ||
| Registered voters/turnout | 3,549,291 | 66.20 | ||
| Source: IEPC-Chiapas | ||||
Guanajuato Governor Election
| Candidate | Party | Votes | % | |
|---|---|---|---|---|
| Diego Sinhué Rodríguez Vallejo | National Action Party | 1,043,049 | 49.29 | |
| Ricardo Sheffield Padilla | Morena | 553,639 | 26.16 | |
| Gerardo Sánchez García | Institutional Revolutionary Party | 293,824 | 13.89 | |
| Felipe Camarena | Ecologist Green Party of Mexico | 157,767 | 7.46 | |
| María Bertha Solórzano | New Alliance Party | 66,122 | 3.12 | |
| Non-registered candidates | 1,673 | 0.08 | ||
| Total | 2,116,074 | 100.00 | ||
| Valid votes | 2,116,074 | 96.70 | ||
| Invalid/blank votes | 72,183 | 3.30 | ||
| Total votes | 2,188,257 | 100.00 | ||
| Registered voters/turnout | 4,359,531 | 50.19 | ||
| Source: IEEG | ||||
Jalisco Governor Election
| Candidate | Party | Votes | % | |
|---|---|---|---|---|
| Enrique Alfaro Ramírez | Citizens' Movement | 1,354,014 | 40.31 | |
| Carlos Lomelí Bolaños | Morena | 857,011 | 25.51 | |
| Miguel Castro Reynoso | Institutional Revolutionary Party | 575,744 | 17.14 | |
| Miguel Ángel Martínez Espinosa | National Action Party | 369,470 | 11.00 | |
| Salvador Cosío Gaona | Ecologist Green Party of Mexico | 96,762 | 2.88 | |
| Martha Rosa Araiza Soltero | New Alliance Party | 68,597 | 2.04 | |
| Carlos Orozco Santillán | Party of the Democratic Revolution | 35,107 | 1.05 | |
| Non-registered candidates | 2,691 | 0.08 | ||
| Total | 3,359,396 | 100.00 | ||
| Valid votes | 3,359,396 | 96.87 | ||
| Invalid/blank votes | 108,368 | 3.13 | ||
| Total votes | 3,467,764 | 100.00 | ||
| Registered voters/turnout | 5,904,211 | 58.73 | ||
| Source: IEPC-Jalisco | ||||
Morelos Governor Election
| Candidate | Party | Votes | % | |
|---|---|---|---|---|
| Cuauhtémoc Blanco | Social Encounter Party | 501,743 | 54.42 | |
| Víctor Caballero | National Action Party | 134,054 | 14.54 | |
| Rodrigo Gayosso | Party of the Democratic Revolution | 111,198 | 12.06 | |
| Jorge Meade | Institutional Revolutionary Party | 57,943 | 6.28 | |
| Fidel Demédicis Hidalgo | Independent | 45,280 | 4.91 | |
| Nadia Luz Lara | Ecologist Green Party of Mexico | 35,047 | 3.80 | |
| Alejandro Vera Jiménez | New Alliance Party | 21,977 | 2.38 | |
| Mario Rojas Alba | Humanist Party | 13,871 | 1.50 | |
| Non-registered candidates | 871 | 0.09 | ||
| Total | 921,984 | 100.00 | ||
| Valid votes | 921,984 | 96.64 | ||
| Invalid/blank votes | 32,036 | 3.36 | ||
| Total votes | 954,020 | 100.00 | ||
| Registered voters/turnout | 1,442,857 | 66.12 | ||
| Source: IMPEPAC | ||||
Puebla Governor Election
| Candidate | Party | Votes | % | |
|---|---|---|---|---|
| Martha Erika Alonso Hidalgo | National Action Party | 1,153,043 | 39.84 | |
| Miguel Barbosa Huerta | Morena | 1,031,043 | 35.62 | |
| Enrique Doger | Institutional Revolutionary Party | 555,041 | 19.18 | |
| Michel Chaín | Ecologist Green Party of Mexico | 153,456 | 5.30 | |
| Non-registered candidates | 1,947 | 0.07 | ||
| Total | 2,894,530 | 100.00 | ||
| Valid votes | 2,894,530 | 95.73 | ||
| Invalid/blank votes | 129,023 | 4.27 | ||
| Total votes | 3,023,553 | 100.00 | ||
| Registered voters/turnout | 4,500,580 | 67.18 | ||
| Source: IEE-Puebla | ||||
Tabasco Governor Election
| Candidate | Party | Votes | % | |
|---|---|---|---|---|
| Adán Augusto López Hernández | Morena | 601,987 | 64.22 | |
| Gerardo Gaudiano Rovirosa | Party of the Democratic Revolution | 189,564 | 20.22 | |
| Georgina Trujillo Zentella | Institutional Revolutionary Party | 115,164 | 12.29 | |
| Jesús Alí de la Torre | Independent | 19,434 | 2.07 | |
| Manuel Paz Ojeda | New Alliance Party | 10,371 | 1.11 | |
| Non-registered candidates | 843 | 0.09 | ||
| Total | 937,363 | 100.00 | ||
| Valid votes | 937,363 | 95.70 | ||
| Invalid/blank votes | 42,134 | 4.30 | ||
| Total votes | 979,497 | 100.00 | ||
| Registered voters/turnout | 1,687,618 | 58.04 | ||
| Source: IEPC-Tabasco | ||||
Veracruz Governor Election
| Candidate | Party | Votes | % | |
|---|---|---|---|---|
| Cuitláhuac García Jiménez | Morena | 1,667,239 | 45.22 | |
| Miguel Ángel Yunes Márquez | National Action Party | 1,453,938 | 39.43 | |
| José Yunes Zorrilla | Institutional Revolutionary Party | 528,663 | 14.34 | |
| Miriam González Sheridan | New Alliance Party | 36,404 | 0.99 | |
| Non-registered candidates | 784 | 0.02 | ||
| Total | 3,687,028 | 100.00 | ||
| Valid votes | 3,687,028 | 97.36 | ||
| Invalid/blank votes | 99,893 | 2.64 | ||
| Total votes | 3,786,921 | 100.00 | ||
| Registered voters/turnout | 5,775,918 | 65.56 | ||
| Source: OPLE-Veracruz | ||||
Yucatán Governor Election
| Candidate | Party | Votes | % | |
|---|---|---|---|---|
| Mauricio Vila Dosal | National Action Party | 447,753 | 40.37 | |
| Mauricio Sahuí Rivero | Institutional Revolutionary Party | 407,802 | 36.77 | |
| Joaquín Díaz Mena | Morena | 231,330 | 20.86 | |
| Jorge Zavala Castro | Party of the Democratic Revolution | 21,968 | 1.98 | |
| Non-registered candidates | 251 | 0.02 | ||
| Total | 1,109,104 | 100.00 | ||
| Valid votes | 1,109,104 | 98.12 | ||
| Invalid/blank votes | 21,303 | 1.88 | ||
| Total votes | 1,130,407 | 100.00 | ||
| Registered voters/turnout | 1,544,062 | 73.21 | ||
| Source: IEPAC | ||||
Who Voted in 2018?
This table shows information about the people who voted in the 2018 election.
| Demographic Subgroup | AMLO | RA | JAM | N/A |
|---|---|---|---|---|
| Total Vote in percentage | 53.19% | 22.27% | 16.40% | --- |
| By Sex | ||||
| Women | 25.20% | 20.90% | 16.30% | 31.30% |
| Men | 34.50% | 21.60% | 16.50% | 24.30% |
| By Age | ||||
| 18 to 29 years | 32.30% | 18.70% | 12.20% | 29.50% |
| 30 to 49 years | 27.70% | 26.90% | 16.30% | 25.60% |
| 50 years + | 29.60% | 14.20% | 20.70% | 31.10% |
| By Education | ||||
| Elementary or Less | 27.40% | 14.60% | 22.90% | 32.10% |
| Middle School/High School | 32.10% | 23.80% | 14.10% | 25.50% |
| University Or More | 28.10% | 26.00% | 12.60% | 23.10% |
| By Socioeconomic Level | ||||
| Upper-Class | 32.90% | 26.90% | 14.60% | 22.20% |
| Middle-Class | 28.80% | 20.30% | 17.70% | 28.00% |
| Lower-Class | 28.50% | 19.40% | 16.00% | 31.00% |
| Confidence In the National Electoral Institute (INE) | ||||
| Better With INE | 26.80% | |||
| Was Better with IFE | 18.60% | |||
| Both are the Same | 43.70% | |||
| Doesn't Know/No Answer | 10.90% | |||
See also
 In Spanish: Elecciones federales de México de 2018 para niños
 | Tommie Smith |
 | Simone Manuel |
 | Shani Davis |
 | Simone Biles |
 | Alice Coachman |


