
Chelan, Washington facts for kids
Quick facts for kids
Chelan, Washington
|
|
|---|---|

Chelan Riverwalk
|
|

Location of Chelan, Washington
|
|
| Country | United States |
| State | Washington |
| County | Chelan |
| Area | |
| • Total | 6.86 sq mi (17.78 km2) |
| • Land | 6.69 sq mi (17.32 km2) |
| • Water | 0.17 sq mi (0.45 km2) |
| Elevation | 1,772 ft (540 m) |
| Population
(2020)
|
|
| • Total | 4,222 |
| • Density | 633.43/sq mi (244.57/km2) |
| Time zone | UTC−8 (Pacific (PST)) |
| • Summer (DST) | UTC−7 (PDT) |
| ZIP code |
98816
|
| Area code | 509 |
| FIPS code | 53-11615 |
| GNIS feature ID | 2409440 |
| Website | City of Chelan |
Chelan (pronounced shə-LAN) is a city in Chelan County, Washington, United States. It is located at the southeast end of Lake Chelan. This is where the lake flows into the Chelan River. In 2020, about 4,222 people lived there. Chelan is part of the larger Wenatchee area.
Contents
History of Chelan
The first people in the Chelan area were the Chelan tribe. They were Native Americans who spoke a Salish language. Not much is known about their early culture. By the time Europeans arrived, the tribe had adopted customs from the Plains Indians. Sadly, diseases like smallpox killed many Native Americans before white settlers came.
Early Leaders and Land Claims
Before settlers arrived, Chelan tribal decisions were made by small family groups. As more white settlers came, the tribes needed one leader. This leader would help them protect their land. Chief Moses agreed to represent the Chelan tribe. He almost got them a large Indian reservation. However, the tribe's small population made it hard to defend their land. More and more miners were looking for gold in the mountains.
Camp Chelan and First Settlers
In the 1870s, the United States Army set up Camp Chelan. This camp was at the foot of Lake Chelan. Its purpose was to control and protect the Native American population. The lake was hard to reach because of its steep cliffs. So, a temporary road was built from the fort to the Columbia River. This road helped with mail service. The small village of Chelan Falls later grew there. The fort closed in October 1880.
The first European settlers arrived in 1886. They were William Sanders and Henry Dumpke. They traveled through cliffs and streams to reach the lake. The natives welcomed them and encouraged them to claim land. More settlers soon followed. In 1888, L.H. Woodin, a lumber broker, came to the valley. He built a sawmill at the lake's foot. Ranchers also found that they could grow fruit orchards without needing to water them.
Growth of the Town
The town was planned out, and land lots sold quickly. A post office opened in 1890. A school was built in 1892. Then, a resort hotel opened, taking advantage of the beautiful area. After a financial crisis in 1893, Chelan faced tough times. But it did better than some other towns. The town's first bank opened in 1893. Chelan officially became a city on May 7, 1902. In 1903, the city got electric lights and water service. Chelan's first town hall was built in 1904. It was destroyed by fire in 1927. The town continues to grow as a farming and resort community today.
Geography and Climate
Chelan is located in Washington state. The city has a total area of about 6.35 square miles (16.45 square kilometers). Most of this area is land, with a small part being water.
Chelan's Climate
Chelan's climate is typical for Eastern Washington. It is located behind the Cascade Mountains. This area is called a "rain shadow." It means the mountains block most of the rain. So, Chelan gets very little rain each year, almost like a desert.
| Climate data for Chelan, Washington (1991–2020 normals, extremes 1891–present) | |||||||||||||
|---|---|---|---|---|---|---|---|---|---|---|---|---|---|
| Month | Jan | Feb | Mar | Apr | May | Jun | Jul | Aug | Sep | Oct | Nov | Dec | Year |
| Record high °F (°C) | 62 (17) |
63 (17) |
74 (23) |
88 (31) |
98 (37) |
111 (44) |
109 (43) |
106 (41) |
97 (36) |
88 (31) |
72 (22) |
65 (18) |
111 (44) |
| Mean maximum °F (°C) | 47.8 (8.8) |
52.1 (11.2) |
63.4 (17.4) |
74.9 (23.8) |
86.4 (30.2) |
90.3 (32.4) |
98.5 (36.9) |
98.6 (37.0) |
89.2 (31.8) |
75.0 (23.9) |
57.9 (14.4) |
48.3 (9.1) |
100.1 (37.8) |
| Mean daily maximum °F (°C) | 34.3 (1.3) |
41.7 (5.4) |
51.9 (11.1) |
62.1 (16.7) |
71.9 (22.2) |
77.9 (25.5) |
86.6 (30.3) |
87.0 (30.6) |
77.2 (25.1) |
62.2 (16.8) |
45.7 (7.6) |
34.9 (1.6) |
61.1 (16.2) |
| Daily mean °F (°C) | 28.0 (−2.2) |
33.0 (0.6) |
41.1 (5.1) |
49.8 (9.9) |
59.0 (15.0) |
65.4 (18.6) |
72.8 (22.7) |
72.5 (22.5) |
63.2 (17.3) |
50.5 (10.3) |
37.6 (3.1) |
28.7 (−1.8) |
50.1 (10.1) |
| Mean daily minimum °F (°C) | 21.6 (−5.8) |
24.3 (−4.3) |
30.3 (−0.9) |
37.5 (3.1) |
46.2 (7.9) |
53.0 (11.7) |
59.1 (15.1) |
58.1 (14.5) |
49.2 (9.6) |
38.8 (3.8) |
29.5 (−1.4) |
22.6 (−5.2) |
39.2 (4.0) |
| Mean minimum °F (°C) | 10.7 (−11.8) |
16.0 (−8.9) |
23.5 (−4.7) |
32.1 (0.1) |
38.7 (3.7) |
46.6 (8.1) |
52.4 (11.3) |
51.7 (10.9) |
42.4 (5.8) |
30.2 (−1.0) |
21.0 (−6.1) |
13.8 (−10.1) |
6.8 (−14.0) |
| Record low °F (°C) | −18 (−28) |
−15 (−26) |
4 (−16) |
21 (−6) |
28 (−2) |
33 (1) |
35 (2) |
42 (6) |
26 (−3) |
3 (−16) |
−3 (−19) |
−18 (−28) |
−18 (−28) |
| Average precipitation inches (mm) | 1.52 (39) |
1.22 (31) |
1.09 (28) |
0.75 (19) |
1.05 (27) |
0.87 (22) |
0.42 (11) |
0.32 (8.1) |
0.34 (8.6) |
1.04 (26) |
1.51 (38) |
1.83 (46) |
11.96 (304) |
| Average snowfall inches (cm) | 7.7 (20) |
2.0 (5.1) |
0.7 (1.8) |
0.0 (0.0) |
0.0 (0.0) |
0.0 (0.0) |
0.0 (0.0) |
0.0 (0.0) |
0.0 (0.0) |
0.0 (0.0) |
1.4 (3.6) |
8.7 (22) |
20.5 (52) |
| Average precipitation days (≥ 0.01 inch) | 9.3 | 7.2 | 7.1 | 5.1 | 6.2 | 4.6 | 2.7 | 2.0 | 2.4 | 6.3 | 8.5 | 9.5 | 70.9 |
| Average snowy days (≥ 0.1 in) | 5.0 | 1.9 | 0.8 | 0.0 | 0.0 | 0.0 | 0.0 | 0.0 | 0.0 | 0.0 | 1.5 | 5.4 | 14.6 |
| Source: NOAA | |||||||||||||
Population and People
| Historical population | |||
|---|---|---|---|
| Census | Pop. | %± | |
| 1910 | 682 | — | |
| 1920 | 896 | 31.4% | |
| 1930 | 1,403 | 56.6% | |
| 1940 | 1,738 | 23.9% | |
| 1950 | 2,157 | 24.1% | |
| 1960 | 2,402 | 11.4% | |
| 1970 | 2,837 | 18.1% | |
| 1980 | 2,802 | −1.2% | |
| 1990 | 2,969 | 6.0% | |
| 2000 | 3,522 | 18.6% | |
| 2010 | 3,890 | 10.4% | |
| 2020 | 4,222 | 8.5% | |
| U.S. Decennial Census 2015 Estimate |
|||

What the 2010 Census Showed
In 2010, Chelan had 3,890 people living there. There were 1,602 households, which are groups of people living together. The city had about 618 people per square mile.
Most people in Chelan were White (80.1%). About 14.1% were from other races. About 24.2% of the population identified as Hispanic or Latino.
About 29.2% of households had children under 18. Nearly half (49.1%) were married couples. The average household had 2.39 people. The average family had 2.91 people. The median age in Chelan was 44.1 years old. About 22.4% of residents were under 18. About 18.9% were 65 or older. The population was almost evenly split between males (49.9%) and females (50.1%).
Getting Around Chelan
Chelan has two main state highways. U.S. Route 97 Alternate goes south towards Wenatchee. State Route 150 goes west to Manson. There are also bus services in the city provided by Link Transit.
Gallery
-
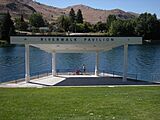
Riverwalk Pavilion
-
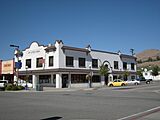
R. W. Little Building
-
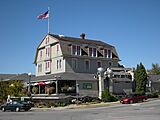
Campbell's
-

Native women on horseback, 1912
-
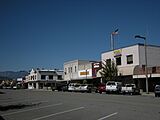
Woodin Avenue


See also
 In Spanish: Chelan (Washington) para niños
