Climate of South Carolina facts for kids

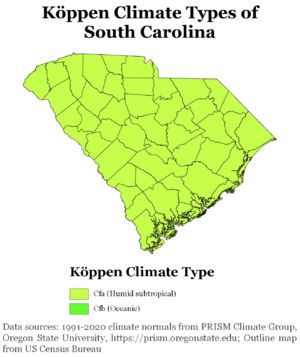
South Carolina mostly has a humid subtropical climate. This means it has hot, sticky summers. Most of the state experiences this type of weather. However, the Blue Ridge Mountains are different. They have small areas with an Oceanic Climate.
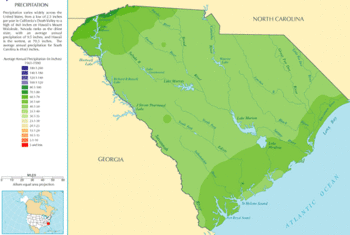
Winters are usually mild in the eastern and southern parts of the state. But, in the northwestern areas, especially higher up, winters can be cool or even cold. Each year, South Carolina gets about 40 to 80 inches (1000 to 2000 mm) of rain. Some parts of the Appalachian temperate rainforest can get over 100 inches (2500 mm)!
Heavy rains come from different types of storms. Tropical cyclones, like hurricanes, bring rain in summer and fall. Regular afternoon thunderstorms also cause summer rain. In fall, winter, and spring, large storm systems called extratropical cyclones bring precipitation. Coastal areas mostly get tropical storms from the Atlantic Ocean. The northwestern part of the state can get storms from the Atlantic. It can also get heavy rain and floods from storms that start in the Gulf of Mexico. These storms move inland from places like Florida or Louisiana.
Tornadoes happen most often in spring. There's also a smaller peak in November. Summer thunderstorms often bring hail and strong winds. Tornadoes are rare in summer unless a tropical storm causes them.
Contents
Temperatures in South Carolina
South Carolina has different climate zones for plants. These are called USDA Hardiness Zones. They range from Zone 7B (where temperatures can drop to 5°F or -15°C) in the far northwest. They go up to Zone 9B (where temperatures stay above 25°F or -4°C) along the southeastern coast.
The state's climate is mostly humid subtropical (called Cfa in the Köppen climate classification system). However, high areas in the "Upstate" region are less subtropical. In summer, South Carolina is hot and humid. Daytime temperatures are usually around 90°F (32°C). Nighttime lows are near 70°F (21°C).
Winter temperatures vary a lot. Coastal areas have very mild winters. Highs are about 60°F (16°C). Overnight lows are around 38°F (3°C). Further inland, in the Piedmont region, daytime temperatures average 50°F (10°C). Nighttime temperatures are about 32°F (0°C).
| Event | Measurement | Date | Location | County |
|---|---|---|---|---|
| Highest temperature | 113 °F (45.0 °C) | June 29, 2012 | USC Columbia | Richland |
| Lowest temperature | −19 °F (−28.3 °C) | January 21, 1985 | Caesars Head | Greenville |
Rain and Other Precipitation
South Carolina gets a lot of rain all year. The coast usually has wetter summers. Inland areas tend to be wettest in March. In colder months, large storm systems cause most of the rain. In summer, tropical storms and afternoon thunderstorms bring the rain.
The Appalachian Mountains create a "rain shadow" effect. This means central parts of the state get less rain. Inland areas typically get 40 to 50 inches (1000 to 1270 mm) of rain. Near the coast, it's 50 to 60 inches (1270 to 1520 mm). The Piedmont region gets 70 to 80 inches (1780 to 2030 mm) of rain.
Winter rain depends a lot on the El Niño-Southern Oscillation. During El Niño, the jet stream moves south and east. This brings cooler and wetter winters to South Carolina. During La Niña, the jet stream stays north and west. This causes warmer and drier winters.
| Event | Measurement | Date | Location | County |
|---|---|---|---|---|
| Most rain in one year for an area | 123.45 inches (3,136 mm) | 2018 | Walhalla State Fish Hatchery | Oconee |
| Least rain in one year for an area | 22.69 inches (58 cm) | ? |
| Event | Measurement | Date | Location | County |
|---|---|---|---|---|
| Greatest 24-hour rainfall | 14.80 inches (376 mm) | September 16, 1999 | Myrtle Beach | Horry |
Snow and Ice

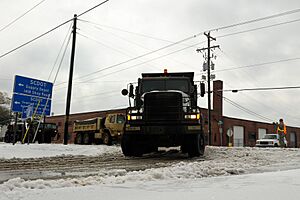
How much snow South Carolina gets changes a lot. In southern coastal areas, snow is very rare. It might not snow for several years. In the Upstate, especially north of Interstate 85, snow is common. They usually get 2 to 3 small snowfalls each year.
In areas like Greenville, Spartanburg, and Anderson, 2 to 5 inches (5 to 13 cm) of snow fall each year. Sometimes, they get 8 inches (20 cm) or more. It's unusual for the Upstate to have a year with no snow.
The Midlands region is harder to predict. About half the time, they get no snow at all. The other half, they might get less than an inch or sometimes 4 to 5 inches (10 to 13 cm). The snowiest place is above 2,000 feet (610 m) in the Blue Ridge Mountains. It averages 12 inches (30 cm) of snow a year.
Freezing rain (rain that freezes when it hits the ground) is more common than snow around Columbia and to its southeast. On the southern coastal islands, any type of frozen rain or snow is very rare.
| Event | Measurement | Date | Location | County |
|---|---|---|---|---|
| Greatest 24-hour snowfall | 24 inches (61 cm) | February 10–11, 1973 | Rimini | Clarendon |
| Most snowfall from one storm | 28.9 inches (73 cm) | February 15–17, 1969 | Caesars Head | Greenville |
Tropical Cyclones (Hurricanes)
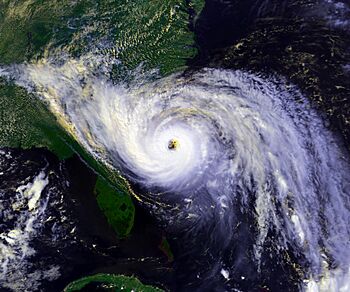
South Carolina often experiences tropical cyclones, also known as hurricanes. This is a yearly concern during hurricane season, which runs from June to November. The most active time for the southeast Atlantic coast is from early August to early October. This is when tropical storms happen most often.
Strong hurricanes can hit South Carolina. However, no Category 5 hurricanes (the strongest kind) have ever made landfall there. Two of the most powerful hurricanes to hit recently were Hurricane Hazel (1954) and Hurricane Hugo (1989). Both were Category 4 storms. For weaker storms, the main impacts are heavy rain and small tornadoes that form in the outer bands.
The wettest tropical storm to hit South Carolina was Jerry in 1995. It stalled nearby and brought almost 19 inches (480 mm) of rain to upstate South Carolina.
| Event | Measurement | Date | Location | County |
|---|---|---|---|---|
| Wettest tropical cyclone | 17.00 inches (432 mm) | Tropical Storm Jerry (1995) |
Antreville | Abbeville |
Thunderstorms and Tornadoes
South Carolina has thunderstorms about 64 days a year. Most of these storms happen during the summer. The state can also be hit by tornadoes. On average, about 14 tornadoes occur each year. No F-5/EF-5 tornadoes (the strongest type) have been recorded. However, more than a dozen F-4/EF-4 tornadoes have happened in many counties across South Carolina.
Monthly Weather Averages for Cities
| Climate data for Greenville, South Carolina (Greenville–Spartanburg Int'l), 1981–2010 normals, extremes 1884–present | |||||||||||||
|---|---|---|---|---|---|---|---|---|---|---|---|---|---|
| Month | Jan | Feb | Mar | Apr | May | Jun | Jul | Aug | Sep | Oct | Nov | Dec | Year |
| Record high °F (°C) | 82 (28) |
81 (27) |
91 (33) |
94 (34) |
100 (38) |
105 (41) |
107 (42) |
105 (41) |
101 (38) |
97 (36) |
86 (30) |
79 (26) |
107 (42) |
| Mean maximum °F (°C) | 69.4 (20.8) |
72.5 (22.5) |
80.8 (27.1) |
86.0 (30.0) |
90.2 (32.3) |
95.1 (35.1) |
97.3 (36.3) |
95.9 (35.5) |
91.1 (32.8) |
84.4 (29.1) |
77.1 (25.1) |
69.5 (20.8) |
98.6 (37.0) |
| Mean daily maximum °F (°C) | 52.4 (11.3) |
56.6 (13.7) |
64.5 (18.1) |
72.8 (22.7) |
80.2 (26.8) |
87.5 (30.8) |
90.3 (32.4) |
88.6 (31.4) |
82.2 (27.9) |
72.8 (22.7) |
63.5 (17.5) |
54.1 (12.3) |
72.1 (22.3) |
| Mean daily minimum °F (°C) | 32.0 (0.0) |
34.9 (1.6) |
41.2 (5.1) |
48.3 (9.1) |
57.2 (14.0) |
65.8 (18.8) |
69.4 (20.8) |
68.7 (20.4) |
61.8 (16.6) |
50.4 (10.2) |
41.3 (5.2) |
34.0 (1.1) |
50.4 (10.2) |
| Mean minimum °F (°C) | 14.6 (−9.7) |
19.0 (−7.2) |
24.2 (−4.3) |
32.6 (0.3) |
42.7 (5.9) |
55.0 (12.8) |
61.7 (16.5) |
60.7 (15.9) |
47.9 (8.8) |
34.1 (1.2) |
26.0 (−3.3) |
18.1 (−7.7) |
11.8 (−11.2) |
| Record low °F (°C) | −6 (−21) |
−5 (−21) |
11 (−12) |
22 (−6) |
27 (−3) |
40 (4) |
53 (12) |
50 (10) |
32 (0) |
25 (−4) |
11 (−12) |
3 (−16) |
−6 (−21) |
| Average precipitation inches (mm) | 3.82 (97) |
3.97 (101) |
4.52 (115) |
3.36 (85) |
3.76 (96) |
3.80 (97) |
4.80 (122) |
4.48 (114) |
3.43 (87) |
3.44 (87) |
3.70 (94) |
4.11 (104) |
47.19 (1,199) |
| Average snowfall inches (cm) | 2.3 (5.8) |
1.0 (2.5) |
0.9 (2.3) |
trace | 0 (0) |
0 (0) |
0 (0) |
0 (0) |
0 (0) |
0 (0) |
0.1 (0.25) |
0.4 (1.0) |
4.7 (12) |
| Average precipitation days (≥ 0.01 in) | 10.2 | 9.2 | 9.6 | 9.0 | 9.7 | 10.4 | 11.7 | 10.4 | 8.1 | 7.2 | 8.9 | 9.8 | 114.2 |
| Average snowy days (≥ 0.1 in) | 1.2 | 0.7 | 0.3 | 0.1 | 0 | 0 | 0 | 0 | 0 | 0 | 0.1 | 0.4 | 2.8 |
| Average relative humidity (%) | 65.8 | 62.6 | 62.1 | 60.7 | 68.5 | 70.5 | 74.0 | 75.6 | 75.8 | 70.9 | 68.2 | 67.7 | 68.5 |
| Mean monthly sunshine hours | 176.6 | 182.7 | 236.2 | 264.7 | 269.2 | 270.8 | 267.8 | 253.9 | 229.2 | 235.2 | 184.3 | 169.4 | 2,740 |
| Percent possible sunshine | 56 | 60 | 64 | 68 | 62 | 62 | 61 | 61 | 62 | 67 | 59 | 55 | 62 |
| Source: NOAA (relative humidity 1962–1990, sun 1961–1990) | |||||||||||||
| Climate data for Myrtle Beach (1991−2020 normals, extremes 1931–present) | |||||||||||||
|---|---|---|---|---|---|---|---|---|---|---|---|---|---|
| Month | Jan | Feb | Mar | Apr | May | Jun | Jul | Aug | Sep | Oct | Nov | Dec | Year |
| Record high °F (°C) | 81 (27) |
86 (30) |
88 (31) |
92 (33) |
99 (37) |
104 (40) |
101 (38) |
104 (40) |
99 (37) |
93 (34) |
86 (30) |
84 (29) |
104 (40) |
| Mean daily maximum °F (°C) | 55.5 (13.1) |
57.8 (14.3) |
63.7 (17.6) |
71.5 (21.9) |
78.8 (26.0) |
84.5 (29.2) |
87.4 (30.8) |
86.5 (30.3) |
83.0 (28.3) |
75.6 (24.2) |
66.4 (19.1) |
58.6 (14.8) |
72.4 (22.4) |
| Daily mean °F (°C) | 44.5 (6.9) |
46.6 (8.1) |
52.7 (11.5) |
61.1 (16.2) |
69.3 (20.7) |
76.2 (24.6) |
79.5 (26.4) |
78.3 (25.7) |
74.0 (23.3) |
64.7 (18.2) |
54.3 (12.4) |
47.4 (8.6) |
62.4 (16.9) |
| Mean daily minimum °F (°C) | 33.6 (0.9) |
35.5 (1.9) |
41.8 (5.4) |
50.6 (10.3) |
59.7 (15.4) |
67.9 (19.9) |
71.6 (22.0) |
70.0 (21.1) |
65.0 (18.3) |
53.8 (12.1) |
42.2 (5.7) |
36.3 (2.4) |
52.3 (11.3) |
| Record low °F (°C) | 10 (−12) |
9 (−13) |
18 (−8) |
25 (−4) |
36 (2) |
48 (9) |
54 (12) |
54 (12) |
43 (6) |
25 (−4) |
16 (−9) |
10 (−12) |
9 (−13) |
| Average precipitation inches (mm) | 3.43 (87) |
3.76 (96) |
3.71 (94) |
3.38 (86) |
3.80 (97) |
4.85 (123) |
6.61 (168) |
6.27 (159) |
6.77 (172) |
4.11 (104) |
3.06 (78) |
3.81 (97) |
53.56 (1,360) |
| Source: NOAA | |||||||||||||
| Climate data for Charleston Int'l, South Carolina (1981–2010 normals, extremes 1938–present) | |||||||||||||
|---|---|---|---|---|---|---|---|---|---|---|---|---|---|
| Month | Jan | Feb | Mar | Apr | May | Jun | Jul | Aug | Sep | Oct | Nov | Dec | Year |
| Record high °F (°C) | 83 (28) |
87 (31) |
90 (32) |
95 (35) |
99 (37) |
103 (39) |
104 (40) |
105 (41) |
99 (37) |
94 (34) |
88 (31) |
83 (28) |
105 (41) |
| Mean maximum °F (°C) | 75.3 (24.1) |
78.1 (25.6) |
83.5 (28.6) |
88.5 (31.4) |
92.7 (33.7) |
96.8 (36.0) |
98.0 (36.7) |
96.5 (35.8) |
92.6 (33.7) |
87.1 (30.6) |
81.9 (27.7) |
76.8 (24.9) |
99.2 (37.3) |
| Mean daily maximum °F (°C) | 59.0 (15.0) |
62.8 (17.1) |
69.6 (20.9) |
76.4 (24.7) |
83.2 (28.4) |
88.4 (31.3) |
91.1 (32.8) |
89.5 (31.9) |
84.8 (29.3) |
77.1 (25.1) |
69.8 (21.0) |
61.6 (16.4) |
76.1 (24.5) |
| Mean daily minimum °F (°C) | 37.5 (3.1) |
40.6 (4.8) |
46.7 (8.2) |
53.3 (11.8) |
61.8 (16.6) |
69.6 (20.9) |
73.0 (22.8) |
72.3 (22.4) |
67.2 (19.6) |
56.8 (13.8) |
47.5 (8.6) |
40.1 (4.5) |
55.5 (13.1) |
| Mean minimum °F (°C) | 21.4 (−5.9) |
25.5 (−3.6) |
30.4 (−0.9) |
38.6 (3.7) |
49.5 (9.7) |
61.1 (16.2) |
67.5 (19.7) |
66.0 (18.9) |
55.6 (13.1) |
41.0 (5.0) |
32.6 (0.3) |
24.0 (−4.4) |
18.8 (−7.3) |
| Record low °F (°C) | 6 (−14) |
12 (−11) |
15 (−9) |
29 (−2) |
36 (2) |
50 (10) |
58 (14) |
56 (13) |
42 (6) |
27 (−3) |
15 (−9) |
8 (−13) |
6 (−14) |
| Average precipitation inches (mm) | 3.71 (94) |
2.96 (75) |
3.71 (94) |
2.91 (74) |
3.02 (77) |
5.65 (144) |
6.53 (166) |
7.15 (182) |
6.10 (155) |
3.75 (95) |
2.43 (62) |
3.11 (79) |
51.03 (1,296) |
| Average snowfall inches (cm) | trace | 0.2 (0.51) |
0 (0) |
0 (0) |
0 (0) |
0 (0) |
0 (0) |
0 (0) |
0 (0) |
0 (0) |
0 (0) |
0.3 (0.76) |
0.5 (1.3) |
| Average precipitation days (≥ 0.01 in) | 9.6 | 8.6 | 7.9 | 7.7 | 7.8 | 11.9 | 13.0 | 13.2 | 10.0 | 7.3 | 7.0 | 8.7 | 112.7 |
| Average snowy days (≥ 0.1 in) | 0.1 | 0.2 | 0 | 0 | 0 | 0 | 0 | 0 | 0 | 0 | 0 | 0.2 | 0.5 |
| Average relative humidity (%) | 69.8 | 67.4 | 68.1 | 67.5 | 72.5 | 75.1 | 76.6 | 78.9 | 78.2 | 74.1 | 72.7 | 71.6 | 72.7 |
| Mean monthly sunshine hours | 179.3 | 186.7 | 243.9 | 275.1 | 294.8 | 279.5 | 287.8 | 256.7 | 219.7 | 224.5 | 189.5 | 171.3 | 2,808.8 |
| Percent possible sunshine | 56 | 61 | 66 | 71 | 69 | 65 | 66 | 62 | 59 | 64 | 60 | 55 | 63 |
| Source: NOAA (relative humidity and sun 1961–1990) | |||||||||||||
| Climate data for Charleston, South Carolina (Downtown), 1981–2010 normals, extremes 1893–present | |||||||||||||
|---|---|---|---|---|---|---|---|---|---|---|---|---|---|
| Month | Jan | Feb | Mar | Apr | May | Jun | Jul | Aug | Sep | Oct | Nov | Dec | Year |
| Record high °F (°C) | 82 (28) |
83 (28) |
94 (34) |
94 (34) |
99 (37) |
104 (40) |
103 (39) |
103 (39) |
100 (38) |
95 (35) |
87 (31) |
81 (27) |
104 (40) |
| Mean maximum °F (°C) | 71.3 (21.8) |
74.6 (23.7) |
79.7 (26.5) |
84.6 (29.2) |
90.0 (32.2) |
94.0 (34.4) |
96.2 (35.7) |
94.2 (34.6) |
91.2 (32.9) |
85.2 (29.6) |
79.0 (26.1) |
73.9 (23.3) |
97.4 (36.3) |
| Mean daily maximum °F (°C) | 56.7 (13.7) |
59.6 (15.3) |
65.0 (18.3) |
72.0 (22.2) |
78.7 (25.9) |
84.5 (29.2) |
87.6 (30.9) |
86.4 (30.2) |
82.0 (27.8) |
74.6 (23.7) |
67.3 (19.6) |
59.5 (15.3) |
72.8 (22.7) |
| Mean daily minimum °F (°C) | 42.8 (6.0) |
45.5 (7.5) |
51.6 (10.9) |
58.8 (14.9) |
67.1 (19.5) |
74.0 (23.3) |
76.9 (24.9) |
76.1 (24.5) |
71.8 (22.1) |
62.5 (16.9) |
53.6 (12.0) |
45.6 (7.6) |
60.5 (15.8) |
| Mean minimum °F (°C) | 27.5 (−2.5) |
31.6 (−0.2) |
36.4 (2.4) |
44.8 (7.1) |
55.6 (13.1) |
66.5 (19.2) |
71.0 (21.7) |
69.8 (21.0) |
61.6 (16.4) |
48.1 (8.9) |
39.1 (3.9) |
30.2 (−1.0) |
24.8 (−4.0) |
| Record low °F (°C) | 10 (−12) |
7 (−14) |
22 (−6) |
36 (2) |
45 (7) |
52 (11) |
61 (16) |
59 (15) |
50 (10) |
37 (3) |
17 (−8) |
12 (−11) |
7 (−14) |
| Average precipitation inches (mm) | 2.94 (75) |
2.51 (64) |
3.30 (84) |
2.53 (64) |
2.16 (55) |
4.65 (118) |
5.40 (137) |
6.71 (170) |
5.76 (146) |
3.67 (93) |
2.19 (56) |
2.60 (66) |
44.42 (1,128) |
| Average precipitation days (≥ 0.01 in) | 9.0 | 8.0 | 7.8 | 6.9 | 6.6 | 10.0 | 11.3 | 11.3 | 8.9 | 6.6 | 6.3 | 8.6 | 101.3 |
| Source: NOAA | |||||||||||||
Statewide Climate Data
| Climate data for South Carolina | |||||||||||||
|---|---|---|---|---|---|---|---|---|---|---|---|---|---|
| Month | Jan | Feb | Mar | Apr | May | Jun | Jul | Aug | Sep | Oct | Nov | Dec | Year |
| Record high °F (°C) | 88 (31) |
89 (32) |
99 (37) |
99 (37) |
106 (41) |
113 (45) |
110 (43) |
110 (43) |
111 (44) |
103 (39) |
93 (34) |
89 (32) |
113 (45) |
| Record low °F (°C) | −19 (−28) |
−11 (−24) |
−8 (−22) |
17 (−8) |
28 (−2) |
37 (3) |
45 (7) |
45 (7) |
28 (−2) |
16 (−9) |
−1 (−18) |
−6 (−21) |
−19 (−28) |
Climate Change in South Carolina
 | James Van Der Zee |
 | Alma Thomas |
 | Ellis Wilson |
 | Margaret Taylor-Burroughs |


