
Hardiness zone facts for kids
A hardiness zone is a special area on a map that tells you how cold it usually gets there in winter. This helps gardeners and farmers know which plants can survive the winter in their area. The most common system was created by the United States Department of Agriculture (USDA). It divides places into 13 zones based on the lowest average winter temperatures. If a plant is "hardy to zone 10," it means it can handle winter temperatures as low as 30 to 40 °F (−1.1 to 4.4 °C).
Other groups, like the UK Royal Horticultural Society, also have their own systems.
In November 2023, the USDA updated its plant hardiness map. This new map uses weather data from 1991 to 2020. It shows that hardiness zones are moving northward, meaning winters are getting warmer in many parts of the United States.
Contents
United States Hardiness Zones (USDA Scale)


The USDA system was first made to help people who garden and work with plants in the United States.
In the U.S., the warmest zones (like zones 9, 10, and 11) are mostly in the southern parts of the country and along the southern coasts. Hawaii has very warm zones, up to zone 12, and Puerto Rico even has zone 13. The middle parts of the country are in zones 6, 7, and 8. The far northern areas and Alaska have the coldest zones, going down to zone 1.
The warmest zone in the main 48 states is in the Florida Keys (11b). The coldest is in north-central Minnesota (2b). Some places in northern Puerto Rico have the warmest zone in the U.S. at 13b. On the other hand, some isolated areas in Alaska have the coldest zone at 1a.
What the Zones Mean
.jpg)
| Zone | From | To | |
|---|---|---|---|
| 0 | a | < −65 °F (−53.9 °C) | |
| b | −65 °F (−53.9 °C) | −60 °F (−51.1 °C) | |
| 1 | a | −60 °F (−51.1 °C) | −55 °F (−48.3 °C) |
| b | −55 °F (−48.3 °C) | −50 °F (−45.6 °C) | |
| 2 | a | −50 °F (−45.6 °C) | −45 °F (−42.8 °C) |
| b | −45 °F (−42.8 °C) | −40 °F (−40 °C) | |
| 3 | a | −40 °F (−40 °C) | −35 °F (−37.2 °C) |
| b | −35 °F (−37.2 °C) | −30 °F (−34.4 °C) | |
| 4 | a | −30 °F (−34.4 °C) | −25 °F (−31.7 °C) |
| b | −25 °F (−31.7 °C) | −20 °F (−28.9 °C) | |
| 5 | a | −20 °F (−28.9 °C) | −15 °F (−26.1 °C) |
| b | −15 °F (−26.1 °C) | −10 °F (−23.3 °C) | |
| 6 | a | −10 °F (−23.3 °C) | −5 °F (−20.6 °C) |
| b | −5 °F (−20.6 °C) | 0 °F (−17.8 °C) | |
| 7 | a | 0 °F (−17.8 °C) | 5 °F (−15 °C) |
| b | 5 °F (−15 °C) | 10 °F (−12.2 °C) | |
| 8 | a | 10 °F (−12.2 °C) | 15 °F (−9.4 °C) |
| b | 15 °F (−9.4 °C) | 20 °F (−6.7 °C) | |
| 9 | a | 20 °F (−6.7 °C) | 25 °F (−3.9 °C) |
| b | 25 °F (−3.9 °C) | 30 °F (−1.1 °C) | |
| 10 | a | 30 °F (−1.1 °C) | +35 °F (1.7 °C) |
| b | +35 °F (1.7 °C) | +40 °F (4.4 °C) | |
| 11 | a | +40 °F (4.4 °C) | +45 °F (7.2 °C) |
| b | +45 °F (7.2 °C) | +50 °F (10 °C) | |
| 12 | a | +50 °F (10 °C) | +55 °F (12.8 °C) |
| b | +55 °F (12.8 °C) | 60 °F (15.6 °C) | |
| 13 | a | 60 °F (15.6 °C) | 65 °F (18.3 °C) |
| b | > 65 °F (18.3 °C) | ||
Hardiness Zones for U.S. Cities
Here are the USDA plant hardiness zones for some U.S. cities, based on the 2023 map:
Why Hardiness Zones Aren't Perfect
Hardiness zones are helpful, but they don't tell the whole story about where a plant can grow. They only focus on the lowest winter temperature. Many other things affect plant survival:
- Frost Dates: When the first and last frosts happen.
- Snow Cover: Snow acts like a blanket, protecting plant roots from extreme cold. Some cold places have reliable snow, which helps plants survive.
- Summer Temperatures: How hot summers get and for how long.
- Sunlight: How strong the sun is.
- Rain and Humidity: How much water plants get and how moist the air is.
- Soil Type: Different soils hold water differently.
- Local Protection: Hills, buildings, or other plants can protect from wind or sun.
For example, Seattle and London are both in zone 8. But Seattle has cooler summers, while Charleston and Madrid, also in zone 8, have very hot summers. Gardeners in these places need to pick very different plants!
Hardiness Zones in Other Countries
Australian Hardiness Zones
Australia has its own hardiness zone system. It uses steps of 5 degrees Celsius. Australian zone 3 is similar to USDA zone 9. The Australian system has higher numbers for warmer zones, with some areas going up to zone 7 (which is like USDA zone 13).
Sometimes, different parts of the same Australian city can be in different zones. This shows how local conditions can vary a lot.
Canadian Hardiness Zones
Canada uses the American hardiness zone system. The Canadian government provides both Canadian and USDA-style zone maps for its country.
How Climate Change Affects Zones
The USDA map from 2012 showed that most of the U.S. had become about 2.8 °C or 5 °F warmer in winter compared to the 1990 map. The 2023 map also shows that about half of the U.S. has shifted to a warmer half-zone. This means that hardiness zones are moving northward as the climate gets warmer. Scientists believe this trend will continue.
Images for kids
-
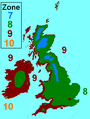
Britain and Ireland's hardiness zones, USDA scale, 2006
-
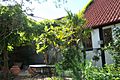
A garden in Simrishamn, southern Sweden.


See also
 In Spanish: Zona de rusticidad para niños
- Agriculture
- Gardening
- Geographical zone
- Hardiness (plants)
- Subtropics
