Climate of the Falkland Islands facts for kids
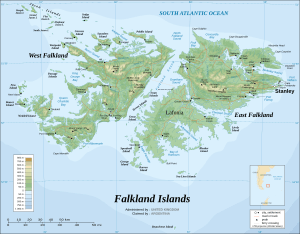
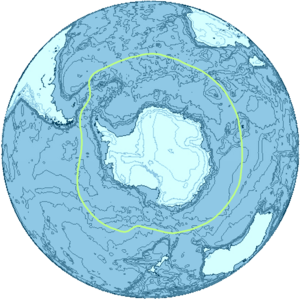
The climate of the Falkland Islands is cool and mild, mostly because of the huge oceans around them. The Falkland Islands are a British Overseas Territory, which means they are part of the UK, located about 480 km (300 mi) from South America. They are just north of a special area called the Antarctic convergence. This is where cold water from the south mixes with warmer water from the north.
Winds usually blow from the west. This causes the eastern islands to get more rain than the western islands. The total rainfall each year is only about 573.6 mm (22.6 in). Even though snow falls, strong winds often blow it away before it can settle on the ground.
The temperature on the islands stays within a small range. It doesn't get hotter than 24 °C (75 °F) or colder than -5 °C (23 °F). In summer, there are many hours of daylight. However, clouds often cover the sky, so the actual amount of sunshine is limited.
Contents
What Kind of Climate Do the Falkland Islands Have?
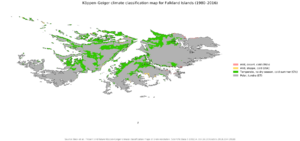
The Falkland Islands have a maritime climate. This means their weather is strongly affected by the ocean. It's a mix between a tundra climate (very cold, treeless areas) and a subpolar climate (cool summers, mild winters). The cool South Atlantic ocean and its currents play a big role in shaping the climate.
A maritime climate usually means that temperatures don't change much between seasons or even during the day. There isn't a clear wet or dry season either. In the subpolar areas, the average highest monthly temperature is above 10 °C (50 °F) for only up to four months a year. The average lowest monthly temperature doesn't drop below -3 °C (27 °F).
Other places with a similar maritime subpolar climate include parts of Iceland, the Faroe Islands, coastal Norway, some southern islands of Alaska, and the southern tip of Patagonia in South America.
Sunshine on the Islands
During the summer, the Falkland Islands have very long days. To make the most of this, the islands use Daylight Saving Time. This means they set their clocks forward by one hour in September and back in April. However, because of a lot of cloud cover, the islands only get about 6 hours of direct sunlight on average in summer. In winter, this drops to just 2–3 hours. In 2011, the government decided to keep the clocks on summer time all year round.
Winds on the Falklands
Most of the winds blowing over the islands come from the west. The wind direction stays pretty much the same throughout the year. The wind speed is usually less than 17 knots (31 km/h) about 60% of the time. It blows between 22 to 33 knots (41 to 61 km/h) for 20–25% of the time. Strong winds, called gales, are common, especially in winter. The average wind speed in Stanley, the capital, is 16 knots (30 km/h).
Temperatures on the Islands
The islands have cool temperatures that don't change much. The average monthly temperatures are around 9 °C (48 °F) in January and February (their summer) and around 2 °C (36 °F) in June and July (their winter). The highest temperature ever recorded is about 24 °C (75 °F) in January, and the lowest is -5 °C (23 °F) in July. The average temperature for the whole year is about 5.6 °C (42.1 °F).
The islands are located about 300 miles (480 km) from the coast of South America. Being north of the Antarctic convergence helps keep the temperatures mild. This is where cold water from Antarctica mixes with warmer water from the Atlantic Ocean.
Rain and Snow
Rainfall is fairly steady throughout the year, but the total amount is low. This is because the islands are located to the east of South America. Due to the westerly winds and the mountains of the Andes on the mainland, the western side of the Falklands is much drier than the eastern side. Also, the eastern slopes of the islands' own hills get more rain than the western slopes.
For example, Port Stanley and Port Howard on the eastern islands both get about 630 mm (25 in) of rain each year. In contrast, islands like Westpoint only get about 430 mm (17 in) a year. The average rainfall for all the islands is around 573.6 mm (22.6 in). The flat areas, especially Lafonia, are the driest parts, receiving only 273–485 mm (10.7–19.1 in) of rain a year.
In 2009, rainfall varied quite a bit across the islands, from 356 mm (14.0 in) at Cape Dolphin to 898 mm (35.4 in) at Port Howard.
During winter, sleet and snow do fall. However, they usually don't stay on the ground for long. The plants on the islands are like those found in a tundra, and the ground often stays wet because water doesn't easily soak into it.
How the Climate is Changing
Over the last 50 years, the climate in the Falkland Islands has become drier and warmer. However, scientists predict that the islands might become cooler with more rain and clouds in the future. This is because melting ice from Antarctica is expected to bring cooler air from the south, which would balance out warmer air from the north. The temperature of the sea around the islands has also been slowly rising since the 1960s.
Rainfall data shows that it increased from 1910 to 1940, then decreased until 1995, and has started to increase again since then. It is also predicted that storms will happen more often and be stronger.
Scientists have gathered this information from weather data collected between 1923 and 1981. More recent data is still being studied. The sea temperature around the islands can change a lot compared to what is expected.
Climate Statistics
| Climate data for Stanley, Falkland Islands, 2m asl, 1929–1970 | |||||||||||||
|---|---|---|---|---|---|---|---|---|---|---|---|---|---|
| Month | Jan | Feb | Mar | Apr | May | Jun | Jul | Aug | Sep | Oct | Nov | Dec | Year |
| Record high °C (°F) | 24.4 (75.9) |
23.3 (73.9) |
21.1 (70.0) |
17.2 (63.0) |
14.1 (57.4) |
10.6 (51.1) |
10.0 (50.0) |
11.1 (52.0) |
15.0 (59.0) |
17.8 (64.0) |
21.7 (71.1) |
21.7 (71.1) |
24.4 (75.9) |
| Mean daily maximum °C (°F) | 13.3 (55.9) |
12.8 (55.0) |
11.7 (53.1) |
9.4 (48.9) |
6.7 (44.1) |
5.0 (41.0) |
4.4 (39.9) |
5.0 (41.0) |
7.2 (45.0) |
8.9 (48.0) |
11.1 (52.0) |
12.2 (54.0) |
9.0 (48.2) |
| Daily mean °C (°F) | 9.5 (49.1) |
8.9 (48.0) |
8.1 (46.6) |
6.1 (43.0) |
3.9 (39.0) |
2.2 (36.0) |
1.9 (35.4) |
2.2 (36.0) |
3.9 (39.0) |
5.3 (41.5) |
7.0 (44.6) |
8.1 (46.6) |
5.6 (42.1) |
| Mean daily minimum °C (°F) | 5.6 (42.1) |
5.0 (41.0) |
4.4 (39.9) |
2.8 (37.0) |
1.1 (34.0) |
0.0 (32.0) |
−0.6 (30.9) |
−0.6 (30.9) |
0.6 (33.1) |
1.7 (35.1) |
2.8 (37.0) |
3.9 (39.0) |
2.2 (36.0) |
| Record low °C (°F) | −1.1 (30.0) |
−1.1 (30.0) |
−2.8 (27.0) |
−6.1 (21.0) |
−6.7 (19.9) |
−11.1 (12.0) |
−8.9 (16.0) |
−11.1 (12.0) |
−10.6 (12.9) |
−5.6 (21.9) |
−3.3 (26.1) |
−1.7 (28.9) |
−11.1 (12.0) |
| Average precipitation mm (inches) | 71 (2.8) |
58 (2.3) |
64 (2.5) |
66 (2.6) |
66 (2.6) |
53 (2.1) |
51 (2.0) |
51 (2.0) |
38 (1.5) |
41 (1.6) |
51 (2.0) |
71 (2.8) |
681 (26.8) |
| Average precipitation days (≥ 0.1 mm) | 15 | 12 | 10 | 11 | 13 | 11 | 12 | 9 | 9 | 7 | 10 | 14 | 133 |
| Average relative humidity (%) | 78 | 79 | 82 | 86 | 88 | 89 | 89 | 87 | 84 | 80 | 75 | 77 | 83 |
| Mean monthly sunshine hours | 198 | 161 | 169 | 115 | 77 | 57 | 69 | 90 | 128 | 189 | 200 | 198 | 1,651 |
| Source 1: Globalbioclimatics/Salvador Rivas-Martínez | |||||||||||||
| Source 2: DMI/Danish Meteorology Institute (sun, humidity, and precipitation days 1931–1960) | |||||||||||||
| Climate data for Mt Pleasant EGYP, E. Falkland, 74m asl, 1999–2019 | |||||||||||||
|---|---|---|---|---|---|---|---|---|---|---|---|---|---|
| Month | Jan | Feb | Mar | Apr | May | Jun | Jul | Aug | Sep | Oct | Nov | Dec | Year |
| Record high °C (°F) | 26.0 (78.8) |
26.8 (80.2) |
25.5 (77.9) |
26.1 (79.0) |
17.8 (64.0) |
15.7 (60.3) |
12.3 (54.1) |
15.11 (59.20) |
22.2 (72.0) |
17.8 (64.0) |
21.7 (71.1) |
25.3 (77.5) |
26.8 (80.2) |
| Mean daily maximum °C (°F) | 16.8 (62.2) |
15.9 (60.6) |
14.6 (58.3) |
10.9 (51.6) |
8.1 (46.6) |
5.9 (42.6) |
5.4 (41.7) |
6.6 (43.9) |
8.8 (47.8) |
11.7 (53.1) |
13.5 (56.3) |
15.4 (59.7) |
11.1 (52.0) |
| Mean daily minimum °C (°F) | 6.2 (43.2) |
6.1 (43.0) |
5.1 (41.2) |
3.3 (37.9) |
1.6 (34.9) |
0.4 (32.7) |
−0.3 (31.5) |
0.3 (32.5) |
1.0 (33.8) |
2.2 (36.0) |
3.4 (38.1) |
5.0 (41.0) |
2.9 (37.2) |
| Record low °C (°F) | −0.1 (31.8) |
−0.8 (30.6) |
−0.6 (30.9) |
−2.8 (27.0) |
−6.1 (21.0) |
−10.1 (13.8) |
−10.3 (13.5) |
−6.5 (20.3) |
−9.8 (14.4) |
−3.1 (26.4) |
−5.5 (22.1) |
−1.5 (29.3) |
−10.1 (13.8) |
| Source: NCDC | |||||||||||||
See also
 In Spanish: Clima de las islas Malvinas para niños
 | George Robert Carruthers |
 | Patricia Bath |
 | Jan Ernst Matzeliger |
 | Alexander Miles |


