County (Liverpool ward) facts for kids
Quick facts for kids County |
|
|---|---|
 County ward within Liverpool |
|
| Population | 11,388 (2021 census) |
| Registered Electors | 7,790 (2023 elections) |
| Metropolitan borough | |
| Metropolitan county | |
| Region | |
| Country | England |
| Sovereign state | United Kingdom |
| EU Parliament | North West England |
| UK Parliament |
|
| Councillors | |
County ward is a special area in Liverpool where people vote for their local representatives. These representatives are called councillors. They help make decisions for the local community. This ward is part of the larger Liverpool Walton area, which has its own Member of Parliament (MP).
Contents
What is a Ward?
A ward is like a neighborhood or district within a city. It's set up for elections. People living in a ward vote for councillors who will represent them on the Liverpool City Council. These councillors work to improve things like parks, schools, and local services in their ward.
How County Ward Has Changed Over Time
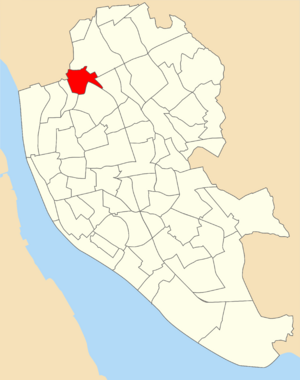
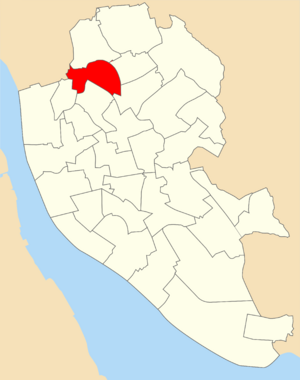
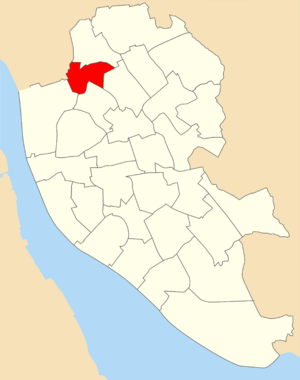
The borders of County ward have changed several times since it was first created in 1953. This happens to make sure each ward has a fair number of people.
County Ward in 1980
In 1980, County ward had three councillors. Its borders were described using local landmarks and roads. For example, it started near Walton Lane and Spellow Lane. It then followed roads like Goodison Road and County Road. It also bordered other wards like Warbreck and Clubmoor.
County Ward in 2004
In 2004, the number of councillors in Liverpool was reduced. County ward's borders changed again. It gained some parts from the old Warbreck ward. It also lost some areas to the new Clubmoor ward. The new borders followed streets like Taylors Lane and Rice Lane. They also went around Walton Hall Park. In 2011, about 14,045 people lived in this version of the ward.
County Ward in 2023
In 2023, there was another big change to the ward boundaries. Instead of 30 wards with three councillors each, Liverpool now has 64 wards with different numbers of councillors. County ward became a two-member ward, meaning it now has two councillors. It kept most of its old area. However, it lost Walton Hall Park and some nearby streets to the new Walton ward. It also lost a small triangle of land to the new Clubmoor West ward.
Today, County ward includes important places like Goodison Park (a famous football stadium), Walton Parish Church, and Alsop High School. In 2021, the population of the ward was 11,388 people.
Who Are the Councillors?
Councillors are elected by the people living in the ward. They represent the community's interests at the city council. Here are the councillors who have represented County ward in recent years:
| Election | Councillor 1 | Councillor 2 | Councillor 3 | ||||
|---|---|---|---|---|---|---|---|
| 2019 | Gerard Woodhouse (Lab) | Roy Gladden (Lab) | Kay Davies (LD) | ||||
| 2021 | Gerard Woodhouse (Lab) | Roy Gladden (Lab) | Maureen Delahunty-Kehoe (Lab) | ||||
| 2023 | Gerard Woodhouse (Ind) | Roy Gladden (Lab) | Maureen Delahunty-Kehoe (Lab) | ||||
|
WARD REFORMED
|
|||||||
| 2023 | John Jennings (Lab) | Bernard Packenham (Lab) | |||||
means the seat was up for election after the ward boundaries changed.
means the seat was up for re-election.
means the councillor changed their political party.
- Councillor Kay Davies left the Labour Party and joined the Liberal Democrats in 2018.
- Councillor Gerard Woodhouse left the Labour Party before the 2023 elections.
Recent Election Results
Elections are how people choose their councillors. Here are the results from the most recent elections in County ward.
Elections in the 2020s
| 4th May 2023 | |||||
|---|---|---|---|---|---|
| Party | Candidate | Votes | % | ±% | |
| Labour | John William Jennings | 1,080 | 33.30 | ||
| Labour | Bernard Edward Packenham | 922 | 28.43 | ||
| Independent | Gerard Woodhouse | 619 | 19.09 | ||
| Independent | Rosemary Nzingha Edwards | 197 | 6.07 | ||
| Liberal Democrats | Geoffrey Ronald Bell | 181 | 5.58 | ||
| Independent | Rosemary Nzingha Edwards | 173 | 5.33 | ||
| Conservative | Louise Margaret Waters | 71 | 2.19 | ||
| Majority | 461 | ||||
| Turnout | |||||
| Rejected ballots | 32 | ||||
| Total ballots | |||||
| Registered electors | 7,790 | ||||
| Labour win (new seat) | |||||
| Labour win (new seat) | |||||
| Liverpool City Council Municipal Elections 2021: 6th May 2021 | |||||
|---|---|---|---|---|---|
| Party | Candidate | Votes | % | ±% | |
| Labour | Maureen Patricia Delahunty-Kehoe | 1,608 | 70.50 | ||
| Green | Linda Jeanne Jones | 213 | 9.34 | ||
| Liberal Democrats | Jez Clein | 190 | 8.33 | ||
| Liberal | Irene Morrison | 142 | 6.23 | ||
| Conservative | Irene Stuart | 128 | 5.61 | ||
| Majority | 1,395 | 61.16 | |||
| Turnout | 2281 | 24.70 | |||
| Registered electors | 9,234 | ||||
| Rejected ballots | 67 | 2.85 | |||
| Total ballots | 2,348 | ||||
| Labour hold | Swing | -7.15 | |||
Elections in the 2010s
| Liverpool City Council Municipal Elections 2019: 2nd May 2019 | |||||
|---|---|---|---|---|---|
| Party | Candidate | Votes | % | ±% | |
| Labour | Roy Gladden | 1,635 | 77.64% | ||
| Green | Lina Jeanne Jones | 199 | 9.45% | ||
| Liberal Democrats | Alex Cottrell | 153 | 7.26 | ||
| Conservative | Olivia Georgina Lever | 62 | 2.94% | ||
| Liberal | Irene Morrison | 57 | 2.67% | ||
| Majority | 1,436 | 68.19% | |||
| Turnout | 2,134 | 22.87% | |||
| Registered electors | 9,329 | ||||
| Rejected ballots | 28 | 1.31% | |||
| Labour hold | Swing | -7.51% | |||
| Liverpool City Council Municipal Elections 2018: 3rd May 2018 | |||||
|---|---|---|---|---|---|
| Party | Candidate | Votes | % | ±% | |
| Labour | Gerard Woodhouse | 2,023 | 86.64% | ||
| Liberal Democrats | Robert Charles McAllister-Bell | 147 | 6.30% | ||
| Conservative | Olivia Georgina Lever | 85 | 3.64% | ||
| Green | Ceri Rhys Jones | 80 | 3.43% | ||
| Majority | 1,876 | 80.34% | |||
| Turnout | 2,345 | 24.88% | |||
| Registered electors | 9,427 | ||||
| Rejected ballots | 10 | 0.43% | |||
| Labour hold | Swing | 9.98% | |||
| Liverpool City Council Municipal Elections 2016: 5th May 2016 | |||||
|---|---|---|---|---|---|
| Party | Candidate | Votes | % | ±% | |
| Labour | Kay Eizabeth Davies | 1,813 | 73.19% | -3.49% | |
| Liberal Democrats | Rachel Plant | 317 | 12.80% | +6.81% | |
| Green | Chris Melia-Jones | 239 | 9.65% | +4.91% | |
| Conservative | Brian James Jones | 88 | 3.55% | +1.30% | |
| TUSC | Lynne Wild | 20 | 0.81% | -0.63% | |
| Majority | 1,496 | 60.39% | -8.11% | ||
| Registered electors | 9,309 | ||||
| Turnout | 2,521 | 27.08% | -33.91% | ||
| Labour hold | Swing | -5.15% | |||
| Liverpool City Council Municipal Elections 2015: 7th May 2015 | |||||
|---|---|---|---|---|---|
| Party | Candidate | Votes | % | ±% | |
| Labour | Roy Gladden | 4,433 | 76.68% | -0.34% | |
| UKIP | Robert Thompson | 473 | 8.18% | -6.38% | |
| Liberal Democrats | Karen Elisabeth Afford | 346 | 5.99% | n/a | |
| Green | Ashley Scott-Griffiths | 274 | 4.74% | +1.44% | |
| Conservative | Brian James Jones | 130 | 2.25% | +0.53% | |
| TUSC | Lynne Wild | 83 | 1.44% | n/a | |
| Liberal | Stephen Francis Houghland | 42 | 0.73% | -2.68% | |
| Majority | 3,960 | 68.50% | +6.04% | ||
| Registered electors | 9,518 | ||||
| Turnout | 5,805 | 60.99% | +31.92% | ||
| Labour hold | Swing | 3.02% | |||
| Liverpool City Council Municipal Elections 2014: 22nd May 2014 | |||||
|---|---|---|---|---|---|
| Party | Candidate | Votes | % | ±% | |
| Labour | Gerard Woodhouse | 2,148 | 77.02% | -5.82% | |
| UKIP | Neil Kenny | 406 | 14.56% | +8.63% | |
| Liberal | Stephen Francis Houghland | 95 | 3.41% | +1.55% | |
| Green | Tony Jones | 92 | 3.30% | 1.05% | |
| Conservative | Brian James Jones | 48 | 1.72% | +0.18% | |
| Majority | 1,742 | 62.46% | -14.45% | ||
| Turnout | 2789 | 29.07% | -1.02% | ||
| Labour hold | Swing | -7.22% | |||
| Liverpool City Council Municipal Elections 2012: 3rd May 2012 | |||||
|---|---|---|---|---|---|
| Party | Candidate | Votes | % | ±% | |
| Labour | Eryl Marshall Owen | 2,360 | 82.84% | +9.15% | |
| UKIP | Thomas Marsden Bodcock | 169 | 5.93% | n/a | |
| Liberal Democrats | Michael Thomas Sefton | 142 | 4.98% | -10.04% | |
| Green | Tony Jones | 64 | 2.25% | +0.57% | |
| Liberal | Stephen Houghland | 53 | 1.86% | +1.01% | |
| Conservative | John Ainsley Watson | 44 | 1.54% | -0.39% | |
| British Freedom | Peter James Stafford | 17 | 0.60% | n/a | |
| Majority | 2,191 | 76.91% | +18.24% | ||
| Turnout | 2,849 | 30.09% | -3.18% | ||
| Labour gain from Liberal Democrat | Swing | +1.61% | |||
| Liverpool City Council Municipal Elections 2011: 5th May 2011 | |||||
|---|---|---|---|---|---|
| Party | Candidate | Votes | % | ±% | |
| Labour | Roy Butler Gladden | 2330 | 73.69% | +13.02% | |
| Liberal Democrats | Karen Elisabeth Afford | 475 | 15.02% | -15.81% | |
| UKIP | Tom Bodcock | 138 | 4.36% | n/a | |
| TUSC | Roger Bannister | 78 | 2.47% | n/a | |
| Conservative | John Astley Watson | 61 | 1.93% | -1.09% | |
| Green | Tony Jones | 53 | 1.68% | +0.5% | |
| Liberal | Stephen Francis Houghland | 27 | 0.85% | n/a | |
| Majority | 1855 | 58.67% | +28.83 | ||
| Turnout | 3162 | 33.27% | -19.55% | ||
| Labour gain from Liberal Democrat | Swing | 14.42% | |||
| Liverpool City Council Municipal Elections 2010: County | |||||
|---|---|---|---|---|---|
| Party | Candidate | Votes | % | ±% | |
| Labour | Gerard Woodhouse | 3131 | 60.67% | ||
| Liberal Democrats | Ruth Gould | 1591 | 30.83% | ||
| BNP | Peter James Stafford | 222 | 4.30% | ||
| Conservative | Angela Maria Oates | 156 | 3.02% | ||
| Green | Tony Jones | 61 | 1.18% | ||
| Majority | 1540 | 29.84% | |||
| Turnout | 5161 | 52.82% | |||
| Labour gain from Liberal Democrat | Swing | ||||
Elections in the 2000s
| Liverpool City Council Municipal Elections 2008: County | |||||
|---|---|---|---|---|---|
| Party | Candidate | Votes | % | ±% | |
| Liberal Democrats | Marilyn Fielding | 1196 | 42.70% | ||
| Labour | Gerard Woodhouse | 1189 | 42.45% | ||
| BNP | Peter James Stafford | 200 | 7.14% | ||
| UKIP | Colin Windever | 70 | 2.50% | ||
| Conservative | Paul Martyn Barber | 66 | 2.36% | ||
| Green | Tony Jones | 48 | 1.71% | ||
| Liberal | Roger George Webb | 32 | 1.14% | ||
| Majority | |||||
| Turnout | 2801 | 27.66% | |||
| Liberal Democrat hold | Swing | ||||
| Liverpool City Council Municipal Elections 2007: County | |||||
|---|---|---|---|---|---|
| Party | Candidate | Votes | % | ±% | |
| Liberal Democrats | Karen Afford | 1541 | 58.46% | ||
| Labour | Colin McAlley | 859 | 32.59% | ||
| Conservative | Jennifer Kelly | 62 | 2.35% | ||
| Liberal | Roger George Webb | 53 | 2.01% | ||
| Majority | |||||
| Turnout | 2636 | 25.53% | |||
| Liberal Democrat hold | Swing | ||||
| Liverpool City Council Municipal Elections 2006: County | |||||
|---|---|---|---|---|---|
| Party | Candidate | Votes | % | ±% | |
| Liberal Democrats | Paul Clark | 1380 | 52.73% | ||
| Labour | Patrick Delahunty | 1080 | 41.27% | ||
| Liberal | Roger George Webb | 84 | 3.21% | ||
| Conservative | Francis Victor Stevens | 73 | 2.79% | ||
| Majority | |||||
| Turnout | 2617 | 24.07% | |||
| Liberal Democrat hold | Swing | ||||
After the boundary change of 2004 the whole of Liverpool City Council faced election. Three Councillors were returned.
| Liverpool City Council Municipal Elections 2004: County | |||||
|---|---|---|---|---|---|
| Party | Candidate | Votes | % | ±% | |
| Liberal Democrats | Marilyn Fielding | 2067 | |||
| Liberal Democrats | Karen Afford | 1881 | |||
| Liberal Democrats | Paul Clark | 1869 | |||
| Labour | Gary Booth | 1515 | |||
| Labour | Patrick Delahunty | 1515 | |||
| Labour | Jeanette Fearon | 1440 | |||
| Liberal | Roger Webb | 96 | |||
| Liberal | Thomas Newell | 95 | |||
| Liberal | Damian O'Brien | 60 | |||
| Majority | |||||
| Turnout | 3824 | 34.33% | |||
| Liberal Democrat hold | Swing | n/a | |||
• italics - Shows a councillor who was already in office.
• bold - Shows the candidate who won the election.


