Demographics of Hispanic and Latino Americans facts for kids

The demographics of Hispanic and Latino Americans describe the people who identify as Hispanic or Latino in the United States. This group is the second-largest ethnic group in the country. As of recent counts, there are about 62 million Hispanic and Latino people, making up 18.7% of the total U.S. population.
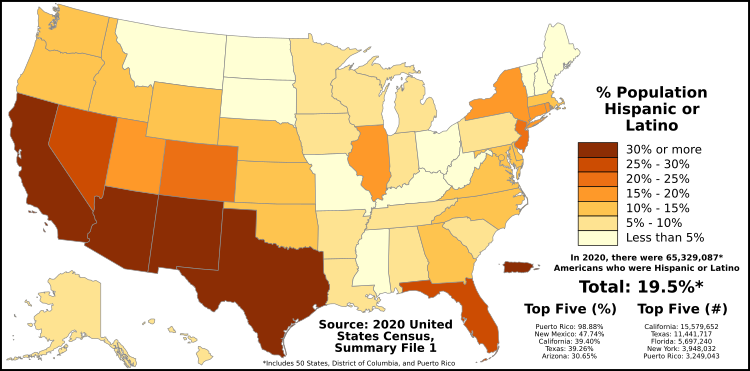
This group is generally younger than the rest of the country. They come from many different countries, representing over two dozen national backgrounds. People of Hispanic and Latino heritage belong to every race. They also tend to live longer than other Americans and are mostly found in the southwestern United States.
Contents
A Growing Population
Since the 1960s, Hispanic and Latino Americans have played a big part in changing the population of the United States. Along with Asian Americans, they have helped make minority groups about one-third of the country's population.
By 2009, nearly one out of every six Americans was Hispanic or Latino. This was about 48.4 million people out of an estimated 307 million Americans. The Hispanic and Latino population has grown a lot because of both immigration (people moving to the U.S.) and higher birth rates.
How Many People?
In 2011, Hispanic people made up 16.7% of the U.S. population, which was around 52 million people. Between 2000 and 2007, the Hispanic population grew by 28.7%. This was about four times faster than the growth rate of the entire U.S. population.
Based on the 2010 census, Hispanic people are now the largest minority group in 191 out of 366 major cities and surrounding areas in the U.S. Experts predict that by July 1, 2050, the Hispanic population in the United States could reach 132.8 million people. This would be about 30.2% of the total projected population at that time.
Where Do They Live?
As of 2000, many cities and towns had a majority Hispanic population. Some of the largest places where most people were Hispanic included:
- East Los Angeles (97% Hispanic)
- Laredo, Texas (94%)
- Brownsville, Texas (91%)
- Hialeah, Florida (90%)
- McAllen, Texas (80%)
- El Paso, Texas (77%)
- Santa Ana, California (76%)
- El Monte, California (72%)
- Oxnard, California (66%)
- Miami, Florida (66%)
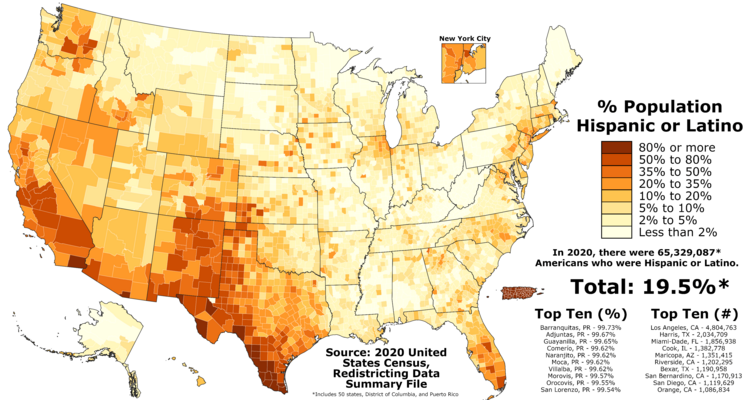
Los Angeles County, California, has the largest Hispanic population of any county in the country. About 4.7 million Hispanic people live there, making up 47% of the county's ten million residents.
Different Backgrounds and Races
When people identify as Hispanic or Latino, they can also identify with any race. Historically, more than half of Hispanic and Latino Americans have identified as White. Many Mexican people identify as White Hispanic. The highest percentage of White Hispanics among major groups comes from the Cuban American community. High percentages also come from Colombian and Spanish communities.
The largest number of Black Hispanics are from the Puerto Rican community. The highest percentage of Black Hispanics among major groups comes from the Dominican community. Many Black Hispanics can also be found among Central American communities.
Some Asian Hispanics are from the Mexican community, while the highest percentage of Asian Hispanics comes from the Peruvian community. The largest group of Native American Hispanics are from the Mexican community, and the highest percentage of Native American Hispanics among major groups comes from the Guatemalan community.
Even though these racial groups make up small percentages of the overall Hispanic and Latino population, they can be a large part of their specific racial group in the U.S. For example, Hispanic and Latino people who are American Indian or Alaska Native make up 15% of all American Indians and Alaska Natives. Also, the 120,000 Hispanic and Latino people who are Native Hawaiian and Other Pacific Islander make up 22% of that entire racial group nationally. Nearly one-third of all people who identify with "Two or more races" are Hispanic or Latino.
See also
 In Spanish: Hispanización de Estados Unidos para niños
- Demographics of the United States
 | Bessie Coleman |
 | Spann Watson |
 | Jill E. Brown |
 | Sherman W. White |


