Economy of Birmingham facts for kids
The city of Birmingham in England is a very important place for making things and for engineering. Lots of people, over 100,000, work in these industries. They help the country's economy by adding billions of pounds. In 2013, the wider West Midlands area sold goods worth £19.6 billion to other countries. This was about 8.73% of all UK exports. However, these sales dropped by 14.5% compared to 2012.
Birmingham was great at creating new jobs between 1951 and 1961, second only to London. Very few people were out of work from 1948 to 1966, usually less than 1%. By 1961, families in the West Midlands (county) earned 13% more than the national average. This was even more than in London! However, the economy grew slowly between 2002 and 2012. Many new skilled jobs went to people who lived outside the city. Some areas in inner-city Birmingham, like Ladywood and Sparkbrook and Small Heath, have the highest unemployment rates in the UK.
Birmingham is also a 'Beta-' global city. This means it's one of the most important cities in the world. It's ranked as the second most influential city in the UK after London. Birmingham has the second largest city economy in the UK, also after London. In 2008, it was ranked 72nd in the world for its economy.
Contents
Birmingham's Economic Strengths
Birmingham is a strong city in many ways. It's known for its business environment and quality of life.
Quality of Life in Birmingham
- In 2013, Birmingham was ranked 10th in the UK for how good life is there. This was based on things like house prices, rent, salaries, and how happy people were.
- In 2010, it was the 52nd most liveable city in the world. This was according to a study that looked at living standards worldwide.
- It was ranked 19th among big UK cities for being 'cycle-friendly' in 2010.
Birmingham as a Business Hub
A survey in 2010 asked 500 European businesses about the best cities for business.
- Birmingham was ranked 18th in Europe overall. It was 3rd in the UK, after London and Manchester.
- It was 9th in Europe for how easy it is to reach customers.
- The city was also praised for its skilled workers and good transport links.
- Office space in Birmingham offers good value for money. It was ranked 5th in Europe for this.
Understanding GVA (Gross Value Added)
GVA, or Gross Value Added, is a way to measure how much money is made by all the goods and services produced in an area. It helps us see how much an economy is growing.
In 2013, Birmingham's GVA was £24.1 billion. This was a big part of the West Midlands (region) total. It was also 1.6% of the UK's total GVA. Only London and Greater Manchester South had higher GVA among similar city areas. The GVA in Birmingham grew by 6% in 2013. This was a strong increase compared to previous years.
How Productive is Birmingham?
Productivity measures how much is produced per worker. In 2012, Birmingham's GVA per employee was about £42,800. This ranked it 6th among major UK cities. It was 3rd among the Core Cities (big cities like London, Edinburgh, and Manchester).
What Industries Drive Birmingham's Economy?
Birmingham's economy is made up of many different industries.
- In 2012, the biggest sector was Public administration, education and health, making up almost 24% of the total GVA.
- Distribution; transport; accommodation and food was also a large sector, making up 17.3%.
- Real estate activities and Production (which includes manufacturing) were also important.
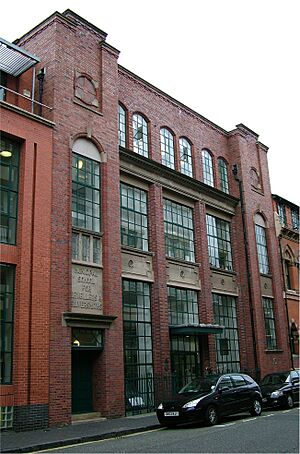
Jewellery Quarter
Birmingham is home to the Jewellery Quarter. This area has the largest number of dedicated jewellers in Europe. It's a very special place where beautiful jewellery is designed and made.
From Factories to Services and Tourism
Like many parts of the UK, Birmingham used to rely a lot on manufacturing (making things in factories). Since the 1970s, this has changed. Now, most people in Birmingham work in service industries, shops, and tourism.
Today, Birmingham still makes many products. These include cars, car parts, weapons, electrical items, plastics, and machine tools. It also produces chemicals, food, jewellery, and glass. Two big car factories are in or near Birmingham: MG Rover in Longbridge and Jaguar in Castle Bromwich. Land Rovers are made nearby in Solihull.
Shopping in Birmingham
Birmingham is a great place to shop! It has one of the largest shopping centres in the UK, called the Bullring.
The city centre has several big shopping centres:
- The Bullring
- The Mailbox
- The Pavilions
- The Pallasades
You can also find famous department stores like Selfridges and House of Fraser. The Mailbox is known for its designer and high-end fashion shops. The city also has several markets, including the Bullring indoor market and the Birmingham rag market.
Tourism and Events
Birmingham is a popular place for visitors. It has major venues like the International Convention Centre, the National Exhibition Centre, and the Symphony Hall. These places host many conferences and exhibitions. In fact, the Birmingham area handles 42% of all conference and exhibition trade in the UK! The city's sports and cultural venues also attract many tourists.
Renewable Energy
Birmingham has a large incineration plant called the Tyseley Energy from Waste Plant. This plant burns waste to create electricity. This electricity is then sent to the National Grid to power homes and businesses. It's a way to turn waste into useful energy.
Famous Brands from Birmingham
Birmingham is known as the "city of a thousand trades" because so many different things were made here. Many famous brands come from Birmingham, such as:
- Bird's Custard
- Typhoo Tea
- Brylcreem (a hair product)
- Chad Valley Toys
- BSA (a company that made bikes and motorcycles)
- Bakelite (an early plastic)
- Cadburys chocolate
- HP Sauce
Jobs and Education
In 2012, Birmingham had a population of about 1,085,400 people. Its population grew by 1.04%, which was one of the highest growth rates among the Core Cities.
Employment in Birmingham
Here's a look at how many people were working or looking for work in Birmingham between July 2012 and June 2013:
- About 69.9% of people aged 16-64 were economically active (meaning they were working or looking for work).
- About 57.5% of people were in employment (had a job).
- About 16.5% were unemployed (looking for a job).
Earnings in Birmingham
In 2013, the average weekly pay for full-time workers living in Birmingham was about £478.6. For those working in Birmingham, the average weekly pay was slightly higher, around £518.6.
Education Achievements
Birmingham's schools show good results. In 2012:
- 88.1% of pupils achieved 5 or more GCSEs (exams taken at age 16) at grades A*-C.
- 60.1% of pupils achieved 5 or more GCSEs at A*-C, including English and Maths. This was slightly better than the England average.
When looking at overall qualifications in 2012:
- 27.6% of people in Birmingham had an NVQ4 or higher (like a university degree).
- 75.5% had an NVQ1 or higher (basic qualifications).
- 15.9% had no qualifications.
Images for kids


