Lauder, New Zealand facts for kids
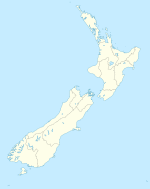
Lauder is a small town in the Otago area of New Zealand's South Island. You can find it in Central Otago, about 8 kilometers (5 miles) northeast of Omakau. It's on State Highway 85, which is the main road between Alexandra and Ranfurly. Lauder got its name from a town in Scotland. Many places in Otago were named after Scottish towns by John Turnbull Thomson.
Long ago, Lauder had a train station on the old Otago Central Railway. Trains arrived here in 1904. Today, the railway is gone, but the path is now the popular Otago Central Rail Trail. Lauder is a great place to stop if you are cycling or walking the trail. It is also very close to the Poolburn Gorge, a beautiful spot on the trail.
Why Lauder is Great for Science
Lauder is a special place for scientists who study the sky and air. It has clear skies, a wide-open view, and dry air. Its location in the southern part of the world also makes it perfect for this kind of research.
The NIWA atmospheric research laboratory is located here. Scientists at NIWA measure the air to learn more about our planet's climate. They study how different parts of the atmosphere, like the stratosphere and troposphere, affect global weather. They also look at things like ozone, gases that harm the ozone layer, sunlight, tiny particles in the air, and greenhouse gases. This helps them understand how our climate is changing.
Because the night sky is so clear, Lauder is also a favorite spot for people who love to look at stars. Both amateur and professional astronomers enjoy the views here.
Lauder's Weather
Lauder has a unique climate. The weather can change quite a bit between summer and winter. The area is known for its dry air and clear skies, which is why it's so good for scientific research.
| Climate data for Lauder, elevation 375 m (1,230 ft), (1991–2020) | |||||||||||||
|---|---|---|---|---|---|---|---|---|---|---|---|---|---|
| Month | Jan | Feb | Mar | Apr | May | Jun | Jul | Aug | Sep | Oct | Nov | Dec | Year |
| Record high °C (°F) | 35.8 (96.4) |
35.0 (95.0) |
31.5 (88.7) |
26.3 (79.3) |
24.0 (75.2) |
19.9 (67.8) |
18.4 (65.1) |
22.2 (72.0) |
24.9 (76.8) |
27.3 (81.1) |
30.7 (87.3) |
32.5 (90.5) |
35.8 (96.4) |
| Mean maximum °C (°F) | 30.7 (87.3) |
30.3 (86.5) |
27.5 (81.5) |
23.2 (73.8) |
19.3 (66.7) |
16.1 (61.0) |
15.2 (59.4) |
16.7 (62.1) |
20.3 (68.5) |
23.2 (73.8) |
26.0 (78.8) |
29.0 (84.2) |
32.2 (90.0) |
| Mean daily maximum °C (°F) | 23.3 (73.9) |
23.1 (73.6) |
20.4 (68.7) |
16.2 (61.2) |
12.3 (54.1) |
8.2 (46.8) |
7.7 (45.9) |
10.7 (51.3) |
13.9 (57.0) |
16.3 (61.3) |
18.7 (65.7) |
21.5 (70.7) |
16.0 (60.9) |
| Daily mean °C (°F) | 16.3 (61.3) |
15.9 (60.6) |
13.4 (56.1) |
9.8 (49.6) |
6.8 (44.2) |
3.3 (37.9) |
2.7 (36.9) |
5.2 (41.4) |
8.0 (46.4) |
10.1 (50.2) |
12.2 (54.0) |
14.8 (58.6) |
9.9 (49.8) |
| Mean daily minimum °C (°F) | 9.3 (48.7) |
8.7 (47.7) |
6.4 (43.5) |
3.4 (38.1) |
1.3 (34.3) |
−1.7 (28.9) |
−2.4 (27.7) |
−0.3 (31.5) |
2.1 (35.8) |
3.9 (39.0) |
5.7 (42.3) |
8.0 (46.4) |
3.7 (38.7) |
| Mean minimum °C (°F) | 1.6 (34.9) |
1.7 (35.1) |
−0.4 (31.3) |
−2.8 (27.0) |
−4.9 (23.2) |
−7.2 (19.0) |
−8.0 (17.6) |
−5.2 (22.6) |
−3.9 (25.0) |
−2.5 (27.5) |
−1.5 (29.3) |
1.1 (34.0) |
−8.5 (16.7) |
| Record low °C (°F) | −1.6 (29.1) |
−1.9 (28.6) |
−3.0 (26.6) |
−5.1 (22.8) |
−7.8 (18.0) |
−15.4 (4.3) |
−19.7 (−3.5) |
−8.5 (16.7) |
−6.7 (19.9) |
−4.6 (23.7) |
−4.3 (24.3) |
−1.7 (28.9) |
−19.7 (−3.5) |
| Average rainfall mm (inches) | 52.7 (2.07) |
43.5 (1.71) |
35.9 (1.41) |
38.1 (1.50) |
34.1 (1.34) |
34.3 (1.35) |
21.5 (0.85) |
18.9 (0.74) |
23.8 (0.94) |
35.6 (1.40) |
41.8 (1.65) |
50.9 (2.00) |
431.1 (16.96) |
| Source: NIWA | |||||||||||||


