MATLAB facts for kids

L-shaped membrane logo
|
|
| Developer(s) | MathWorks |
|---|---|
| Initial release | 1984 |
| Stable release | |
| Written in | C/C++, MATLAB |
| Operating system | Windows, macOS, and Linux |
| Platform | IA-32, x86-64, ARM64 |
| Type | Numerical computing |
| License | Proprietary commercial software |
| Paradigm | multi-paradigm: functional, imperative, procedural, object-oriented, array |
|---|---|
| Designed by | Cleve Moler |
| Developer | MathWorks |
| First appeared | late 1970s |
| Stable release | |
| Typing discipline | dynamic, weak |
| Filename extensions | .m, .p, .mex*, .mat, .fig, .mlx, .mlapp, .mltbx, .mlappinstall, .mlpkginstall |
| Influenced by | |
|
|
| Influenced | |
|
|
|
MATLAB stands for Matrix Laboratory. It is a special computer program and language made by a company called MathWorks. MATLAB is used for doing lots of math and calculations with numbers.
It helps you work with grids of numbers called matrices. You can also use it to draw graphs and charts from data. MATLAB lets you create step-by-step instructions for computers, which are called algorithms. You can even design screens and buttons for programs, known as user interfaces. It can also work with programs written in other computer languages.
Even though MATLAB is mostly for working with numbers, it has extra tools. One tool lets it work with math symbols, not just numbers. Another tool, called Simulink, helps you design and test complex systems, like those in robots or cars.
As of 2020, over four million people around the world use MATLAB. These users are often engineers, scientists, and economists. In 2017, more than 5,000 colleges and universities used MATLAB for teaching and research.
Contents
History of MATLAB
How MATLAB Started
MATLAB was created by a mathematician and computer programmer named Cleve Moler. He got the idea for MATLAB from his PhD studies in the 1960s. Moler became a math professor and started making MATLAB as a hobby for his students. He first developed the math parts of MATLAB in 1967.
Before it became a full programming language, MATLAB was a simple calculator for matrices. It didn't have programs, special tools, or graphics back then.
The first early version of MATLAB was finished in the late 1970s. It was shown to the public in February 1979. Early versions were basic matrix calculators with 71 built-in functions. At first, MATLAB was given away for free to universities. Moler would leave copies at universities he visited, and it became very popular among math students.
In the 1980s, Cleve Moler met John N. Little. They decided to rewrite MATLAB in a different computer language called C. They wanted to sell it for the desktop computers that were replacing big mainframe computers at the time. John Little and Steve Bangert rewrote MATLAB and added new features and tools.
MATLAB Becomes a Business
MATLAB was first sold as a product in 1984. The company MathWorks was started to develop the software. The first sale happened the next year when a person from Massachusetts Institute of Technology bought ten copies.
By the end of the 1980s, hundreds of copies of MATLAB were sold to universities. The software became very popular because experts created special toolboxes for different math tasks. Many of these toolboxes came from students who used MATLAB in college and then used it in their jobs.
Over time, MATLAB was rewritten to work on different computer systems like Digital Equipment Corporation, VAX, Sun Microsystems, and Unix PCs. Version 3 came out in 1987. The first MATLAB compiler, which turns code into a program, was made in the 1990s.
In 2000, MathWorks updated MATLAB 6 to use a new math library. In 2004, they released the Parallel Computing Toolbox, which helps computers do many calculations at once. In 2010, this toolbox also started using graphics processing units (GPUs) to speed things up.
Recent Changes to MATLAB
Big changes were made to MATLAB with version 8 in 2012. The way users interacted with the program (the user interface) was updated. Also, the Simulink tool got many new features.
By 2016, MATLAB had more improvements. These included the MATLAB Live Editor, which is like a smart notebook for writing code.
How to Use MATLAB
The MATLAB program is built around the MATLAB programming language. You can use MATLAB by typing commands directly into its "Command Window." You can also run text files that contain MATLAB code.
"Hello, world!" Example
Here is a simple example of a program that says "Hello, world!" in MATLAB:
disp('Hello, world!')When you run this code, it will show:
Hello, world!Variables in MATLAB
In MATLAB, you create variables using the equals sign, =. A variable is like a container that holds a value.
MATLAB is a flexible language because you don't always have to say what type of data a variable will hold. Its type can even change. Values can be simple numbers, results from calculations, or outputs from a function.
For example:
>> x = 17
x =
 17

>> x = 'hat'
x =
hat

>> x = [3*4, pi/2]
x =
   12.0000    1.5708

>> y = 3*sin(x)
y =
   -1.6097    3.0000
Vectors and Matrices
You can make a simple list of numbers (a vector) using a special colon symbol. For example:
>> array = 1:2:9
array =
 1 3 5 7 9
This creates a list called array that starts at 1, adds 2 each time, and stops before going over 9. So, it has 1, 3, 5, 7, and 9.
If you leave out the middle number, MATLAB will add 1 each time by default:
>> ari = 1:5
ari =
 1 2 3 4 5
This creates a list with 1, 2, 3, 4, and 5.
When you count items in MATLAB lists and matrices, you start from 1. This is different from some other programming languages that start from 0.
You can create matrices (grids of numbers) by putting numbers in square brackets []. Use spaces or commas to separate numbers in a row, and semicolons ; to start a new row. To get a specific number or a smaller part of the matrix, you use parentheses ().
>> A = [16, 3, 2, 13  ; 5, 10, 11, 8 ; 9, 6, 7, 12 ; 4, 15, 14, 1]
A =
 16  3  2 13
  5 10 11  8
  9  6  7 12
  4 15 14  1

>> A(2,3)
ans =
 11
The command A(2,3) gets the number in the second row and third column, which is 11.
You can also select a group of rows and columns. For example, 2:4 means rows 2 through 4.
>> A(2:4,3:4)
ans =
 11 8
 7 12
 14 1
This shows a smaller matrix from rows 2 to 4 and columns 3 to 4.
MATLAB has functions to make special matrices. eye(3,3) makes a 3x3 identity matrix (a square matrix with 1s on the main diagonal and 0s everywhere else). zeros(2,3) makes a 2x3 matrix full of zeros, and ones(2,3) makes a 2x3 matrix full of ones.
>> eye(3,3)
ans =
 1 0 0
 0 1 0
 0 0 1

>> zeros(2,3)
ans =
 0 0 0
 0 0 0

>> ones(2,3)
ans =
 1 1 1
 1 1 1
You can flip a vector or matrix (called transposing) using .' or the transpose function.
>> A = [1 ; 2],  B = A.', C = transpose(A)
A =
     1
     2
B =
     1     2
C =
     1     2
Many MATLAB functions work on every number in an array at once. This is often faster than using loops like for or while.
Structures in MATLAB
MATLAB can store data in "structures." A structure is like a record that can hold different types of information, each with its own name (called a field). For example, you could have a structure for a student with fields like "name," "age," and "grade."
Functions in MATLAB
When you create a MATLAB function, the file name must match the function's name. Function names must start with a letter and can include letters, numbers, or underscores. MATLAB cares about uppercase and lowercase letters.
rgbImage = imread('ecg.png');
grayImage = rgb2bw(rgbImage); % for non-indexed images
level = graythresh(grayImage); % threshold for converting image to binary,
binaryImage = im2bw(grayImage, level);
% Extract the individual red, green, and blue color channels.
redChannel = rgbImage(:, :, 1);
greenChannel = rgbImage(:, :, 2);
blueChannel = rgbImage(:, :, 3);
% Make the black parts pure red.
redChannel(~binaryImage) = 255;
greenChannel(~binaryImage) = 0;
blueChannel(~binaryImage) = 0;
% Now recombine to form the output image.
rgbImageOut = cat(3, redChannel, greenChannel, blueChannel);
imshow(rgbImageOut);
Function Handles
MATLAB lets you create "function handles," which are like shortcuts or references to functions. You can use these to pass functions around in your code.
Classes and Object-Oriented Programming
MATLAB supports object-oriented programming. This is a way of organizing code into "objects" that have properties and actions. It includes concepts like classes (blueprints for objects) and inheritance (where new classes can get features from existing ones).
Here's a simple example of a class:
classdef Hello
    methods
        function greet(obj)
            disp('Hello!')
        end
    end
end
If you save this code in a file named hello.m, you can run it like this:
>> x = Hello();
>> x.greet();
Hello!
Graphics and User Interface Design
<graph>{ "version": 2, "width": 400, "height": 200, "data": [ { "name": "table", "values": [ { "x": 3, "y": 1 }, { "x": 1, "y": 3 }, { "x": 2, "y": 2 }, { "x": 3, "y": 4 } ] } ], "scales": [ { "name": "x", "type": "ordinal", "range": "width", "zero": false, "domain": { "data": "table", "field": "x" } }, { "name": "y", "type": "linear", "range": "height", "nice": true, "domain": { "data": "table", "field": "y" } } ], "axes": [ { "type": "x", "scale": "x" }, { "type": "y", "scale": "y" } ], "marks": [ { "type": "rect", "from": { "data": "table" }, "properties": { "enter": { "x": { "scale": "x", "field": "x" }, "y": { "scale": "y", "field": "y" }, "y2": { "scale": "y", "value": 0 }, "fill": { "value": "steelblue" }, "width": { "scale": "x", "band": "true", "offset": -1 } } } } ] }</graph>
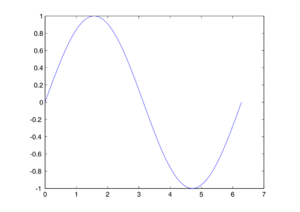
MATLAB has great tools for making graphs. For example, the plot function can draw a graph from two lists of numbers. This code:
x = 0:pi/100:2*pi;
y = sin(x);
plot(x,y)
will create a graph of the sine function:
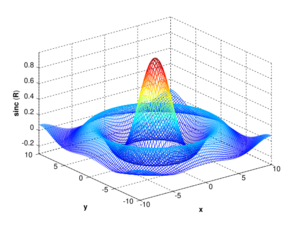
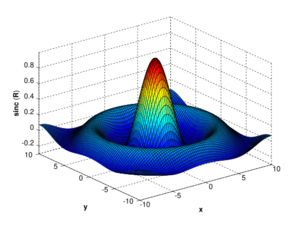
MATLAB can also create 3D graphics:
[X,Y] = meshgrid(-10:0.25:10,-10:0.25:10);
f = sinc(sqrt((X/pi).^2+(Y/pi).^2));
mesh(X,Y,f);
axis([-10 10 -10 10 -0.3 1])
xlabel('{\bfx}')
ylabel('{\bfy}')
zlabel('{\bfsinc} ({\bfR})')
hidden off |
[X,Y] = meshgrid(-10:0.25:10,-10:0.25:10);
f = sinc(sqrt((X/pi).^2+(Y/pi).^2));
surf(X,Y,f);
axis([-10 10 -10 10 -0.3 1])
xlabel('{\bfx}')
ylabel('{\bfy}')
zlabel('{\bfsinc} ({\bfR})') |
|
| This code makes a wireframe 3D graph: | This code makes a surface 3D graph: | |
MATLAB also helps you create graphical user interface (GUI) applications. These are programs with buttons, menus, and windows that users can click on. You can design them using visual tools like GUIDE and App Designer.
MATLAB and Other Computer Languages
MATLAB can use code written in other programming languages like C or Fortran. This means you can combine different types of code. Since 2014, MATLAB has also been able to work more easily with Python.
You can also use libraries (collections of ready-made code) from languages like Java directly in MATLAB. Many MATLAB tools, like those for XML or SQL, are built using these other libraries.
For math that involves symbols, MATLAB can connect to other powerful math programs like Maple or Mathematica.
MATLAB and US Sanctions
In 2020, MATLAB stopped providing services to two universities in China. This happened because of rules from the United States government. The universities said they would start using free, open-source programs and develop their own software instead.
See also
 In Spanish: MATLAB para niños
- Comparison of numerical-analysis software
- List of numerical-analysis software
 | Dorothy Vaughan |
 | Charles Henry Turner |
 | Hildrus Poindexter |
 | Henry Cecil McBay |


