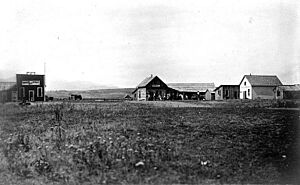
Nespelem, Washington facts for kids
Quick facts for kids
Nespelem
|
|
|---|---|
| Nespelem, Washington | |
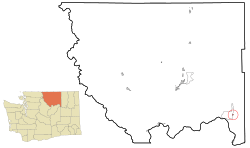
Location of Nespelem, Washington
|
|
| Country | United States |
| State | Washington |
| County | Okanogan |
| Area | |
| • Total | 0.19 sq mi (0.50 km2) |
| • Land | 0.19 sq mi (0.50 km2) |
| • Water | 0.00 sq mi (0.00 km2) |
| Elevation | 1,841 ft (561 m) |
| Population
(2020)
|
|
| • Total | 180 |
| • Density | 950/sq mi (360/km2) |
| Time zone | UTC-8 (Pacific (PST)) |
| • Summer (DST) | UTC-7 (PDT) |
| ZIP code |
99155
|
| Area code(s) | 509 |
| FIPS code | 53-48540 |
| GNIS feature ID | 1512500 |
Nespelem is a small town located in Okanogan County, Washington, in the United States. It's home to about 180 people, based on the 2020 census. This town is special because it's part of the Colville Indian Reservation. The name "Nespelem" comes from a Native American word that means "large flat meadow," which gives you a good idea of what the area might look like!
Contents
A Look Back: Nespelem's History
The town of Nespelem was started by a very important leader named Chief Kamiakin from the Yakama people. It officially became a town on April 15, 1935. Nespelem is also home to a historic cemetery for the Nez Perce tribe. This cemetery was the first burial place for the famous leader Chief Joseph.
Where is Nespelem?
Nespelem is located right by the Nespelem River. You can find it at these coordinates: 48°9′59″N 118°58′32″W / 48.16639°N 118.97556°W.
The United States Census Bureau says that the town covers a total area of about 0.50 square kilometers (or 0.19 square miles). All of this area is land, meaning there are no large bodies of water like lakes or big rivers within the town limits.
Nespelem's Weather
Nespelem has a climate where the temperatures change a lot between seasons. Summers are usually warm to hot, and sometimes humid. Winters are cold, and can even be very cold.
According to the Köppen Climate Classification system, Nespelem has a "dry-summer humid continental climate". This type of climate is often called "Dsb" on climate maps. It means that while it gets cold in winter, the summers are dry.
| Climate data for Nespelem | |||||||||||||
|---|---|---|---|---|---|---|---|---|---|---|---|---|---|
| Month | Jan | Feb | Mar | Apr | May | Jun | Jul | Aug | Sep | Oct | Nov | Dec | Year |
| Record high °F (°C) | 60 (16) |
66 (19) |
79 (26) |
93 (34) |
97 (36) |
101 (38) |
107 (42) |
110 (43) |
102 (39) |
88 (31) |
70 (21) |
58 (14) |
110 (43) |
| Mean daily maximum °F (°C) | 31 (−1) |
39.2 (4.0) |
50.8 (10.4) |
61.9 (16.6) |
70.9 (21.6) |
78.7 (25.9) |
87.3 (30.7) |
86.2 (30.1) |
76.5 (24.7) |
62.7 (17.1) |
44 (7) |
34.5 (1.4) |
60.3 (15.7) |
| Mean daily minimum °F (°C) | 14.8 (−9.6) |
19.9 (−6.7) |
27.2 (−2.7) |
33.2 (0.7) |
39.6 (4.2) |
45.9 (7.7) |
50.3 (10.2) |
49.3 (9.6) |
41.5 (5.3) |
33.5 (0.8) |
26.1 (−3.3) |
19.8 (−6.8) |
33.4 (0.8) |
| Record low °F (°C) | −33 (−36) |
−30 (−34) |
−8 (−22) |
−12 (−24) |
17 (−8) |
28 (−2) |
30 (−1) |
29 (−2) |
17 (−8) |
6 (−14) |
−18 (−28) |
−23 (−31) |
−33 (−36) |
| Average precipitation inches (mm) | 1.33 (34) |
1.12 (28) |
0.97 (25) |
1.02 (26) |
1.16 (29) |
1.14 (29) |
0.52 (13) |
0.58 (15) |
0.77 (20) |
0.99 (25) |
1.73 (44) |
1.68 (43) |
13.01 (330) |
| Average snowfall inches (cm) | 8.6 (22) |
4.8 (12) |
1.4 (3.6) |
0.2 (0.51) |
0 (0) |
0 (0) |
0 (0) |
0 (0) |
0 (0) |
0.2 (0.51) |
3 (7.6) |
9 (23) |
27.3 (69) |
| Average precipitation days | 9 | 7 | 6 | 6 | 7 | 6 | 3 | 3 | 5 | 6 | 9 | 9 | 76 |
Who Lives in Nespelem?
| Historical population | |||
|---|---|---|---|
| Census | Pop. | %± | |
| 1940 | 300 | — | |
| 1950 | 425 | 41.7% | |
| 1960 | 358 | −15.8% | |
| 1970 | 323 | −9.8% | |
| 1980 | 284 | −12.1% | |
| 1990 | 187 | −34.2% | |
| 2000 | 212 | 13.4% | |
| 2010 | 236 | 11.3% | |
| 2020 | 180 | −23.7% | |
| U.S. Decennial Census 2020 Census |
|||
Population in 2010
The 2010 census counted 236 people living in Nespelem. These people lived in 75 different homes, and 53 of those were families. The town had about 1242 people per square mile (or 480 people per square kilometer). There were 77 housing units, which are places where people can live.
When looking at the different groups of people in the town:
- 10.6% were White
- 0.4% were African American
- 80.1% were Native American
- 0.4% were Asian
- 1.3% were from other races
- 7.2% were from two or more races
- About 6.8% of the population identified as Hispanic or Latino (this can include people of any race).
Out of the 75 homes:
- 42.7% had children under 18 living there.
- 24.0% were married couples living together.
- 29.3% were homes where a female head of the household lived without a husband.
- 17.3% were homes where a male head of the household lived without a wife.
- 29.3% were not families (meaning individuals living alone or roommates).
About 17.3% of all homes had just one person living there. And 6.7% of homes had someone living alone who was 65 years old or older. On average, there were about 3.15 people in each household, and about 3.55 people in each family.
The average age of people in Nespelem was 30 years old.
- 29.2% of residents were under 18.
- 15.7% were between 18 and 24.
- 24.6% were between 25 and 44.
- 21.6% were between 45 and 64.
- 8.9% were 65 years old or older.
The town had slightly more males than females, with 52.5% male and 47.5% female residents.
See also
 In Spanish: Nespelem (Washington) para niños
 | Isaac Myers |
 | D. Hamilton Jackson |
 | A. Philip Randolph |


