Pocahontas, Iowa facts for kids
Quick facts for kids
Pocahontas, Iowa
|
|
|---|---|

|
|
| Nickname(s):
The Princess City
|
|

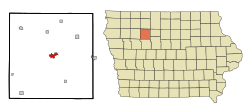
Location of Pocahontas, Iowa
|
|
| Country | |
| State | |
| County | Pocahontas |
| Incorporated | May 16, 1892 |
| Area | |
| • Total | 1.98 sq mi (5.12 km2) |
| • Land | 1.98 sq mi (5.12 km2) |
| • Water | 0.00 sq mi (0.00 km2) |
| Elevation | 1,220 ft (372 m) |
| Population
(2020)
|
|
| • Total | 1,867 |
| • Density | 944.84/sq mi (364.81/km2) |
| Time zone | UTC-6 (Central (CST)) |
| • Summer (DST) | UTC-5 (CDT) |
| ZIP code |
50574
|
| Area code(s) | 712 |
| FIPS code | 19-63975 |
| GNIS feature ID | 0460342 |
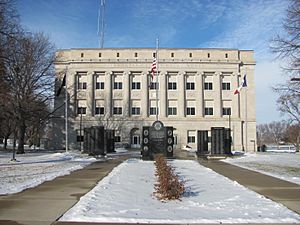
Pocahontas is a city located in Iowa, United States. It is the county seat of Pocahontas County. This means it is the main town where the county government is located.
In 2020, the city had a population of 1,867 people. This was a small decrease from the 1,970 people who lived there in 2000.
Contents
History of Pocahontas, Iowa
Pocahontas was first settled in 1870. It was surveyed by Warrick and Buelah Price from Cleveland, Ohio. The city was named after Pocahontas, a famous Powhatan woman from Jamestown, Virginia.
Other places in the county also have names connected to the Jamestown colony. These include Rolfe, Powhatan Township, and Varina. Pocahontas officially became a city on May 16, 1892.
The 2011 Tornado Outbreak
On April 9, 2011, several tornadoes hit Pocahontas County. Luckily, no one was hurt or killed during these storms. The strongest tornado was an EF4, which is a very powerful type of tornado. It touched down just west of the city.
Geography and Location
Pocahontas is located at 42.734476 degrees north latitude and -94.673017 degrees west longitude. These numbers help pinpoint its exact spot on a map.
The United States Census Bureau says the city covers about 2.02 square miles (5.23 square kilometers). All of this area is land, with no large bodies of water.
Pocahontas is also near the edge of the Manson crater. This is a large impact structure, like a giant bowl in the ground, that is now covered by layers of till and outwash from glaciers.
Climate in Pocahontas
Pocahontas has a type of weather known as a hot-summer humid continental climate. On climate maps, this is often shown as "Dfa." This means the city experiences warm, humid summers and cold winters.
| Climate data for Pocahontas, Iowa, 1991–2020 normals, extremes 1904–present | |||||||||||||
|---|---|---|---|---|---|---|---|---|---|---|---|---|---|
| Month | Jan | Feb | Mar | Apr | May | Jun | Jul | Aug | Sep | Oct | Nov | Dec | Year |
| Record high °F (°C) | 68 (20) |
67 (19) |
87 (31) |
98 (37) |
107 (42) |
106 (41) |
110 (43) |
111 (44) |
101 (38) |
94 (34) |
81 (27) |
68 (20) |
111 (44) |
| Mean maximum °F (°C) | 44.4 (6.9) |
51.3 (10.7) |
69.9 (21.1) |
82.7 (28.2) |
90.6 (32.6) |
94.3 (34.6) |
93.4 (34.1) |
91.5 (33.1) |
89.7 (32.1) |
84.6 (29.2) |
67.7 (19.8) |
51.2 (10.7) |
95.9 (35.5) |
| Mean daily maximum °F (°C) | 25.6 (−3.6) |
30.1 (−1.1) |
43.6 (6.4) |
58.8 (14.9) |
70.9 (21.6) |
81.4 (27.4) |
84.4 (29.1) |
81.8 (27.7) |
76.1 (24.5) |
62.3 (16.8) |
45.0 (7.2) |
31.2 (−0.4) |
57.6 (14.2) |
| Daily mean °F (°C) | 16.6 (−8.6) |
20.9 (−6.2) |
33.8 (1.0) |
47.2 (8.4) |
59.7 (15.4) |
70.4 (21.3) |
73.4 (23.0) |
70.6 (21.4) |
63.2 (17.3) |
49.9 (9.9) |
34.9 (1.6) |
22.4 (−5.3) |
46.9 (8.3) |
| Mean daily minimum °F (°C) | 7.5 (−13.6) |
11.7 (−11.3) |
24.0 (−4.4) |
35.5 (1.9) |
48.5 (9.2) |
59.3 (15.2) |
62.3 (16.8) |
59.5 (15.3) |
50.4 (10.2) |
37.5 (3.1) |
24.7 (−4.1) |
13.6 (−10.2) |
36.2 (2.3) |
| Mean minimum °F (°C) | −14.4 (−25.8) |
−9.6 (−23.1) |
2.2 (−16.6) |
21.3 (−5.9) |
34.4 (1.3) |
46.7 (8.2) |
51.8 (11.0) |
49.0 (9.4) |
34.5 (1.4) |
21.1 (−6.1) |
6.9 (−13.9) |
−8.8 (−22.7) |
−18.3 (−27.9) |
| Record low °F (°C) | −36 (−38) |
−30 (−34) |
−25 (−32) |
2 (−17) |
22 (−6) |
32 (0) |
41 (5) |
35 (2) |
21 (−6) |
−2 (−19) |
−13 (−25) |
−29 (−34) |
−36 (−38) |
| Average precipitation inches (mm) | 1.02 (26) |
1.02 (26) |
2.04 (52) |
3.41 (87) |
4.57 (116) |
4.67 (119) |
4.02 (102) |
4.34 (110) |
2.60 (66) |
2.28 (58) |
1.60 (41) |
1.22 (31) |
32.79 (834) |
| Average snowfall inches (cm) | 9.3 (24) |
7.4 (19) |
5.8 (15) |
1.9 (4.8) |
0.0 (0.0) |
0.0 (0.0) |
0.0 (0.0) |
0.0 (0.0) |
0.0 (0.0) |
0.4 (1.0) |
3.7 (9.4) |
10.3 (26) |
38.8 (99.2) |
| Average precipitation days (≥ 0.01 in) | 7.0 | 6.5 | 8.3 | 9.9 | 13.0 | 11.3 | 9.0 | 8.9 | 8.5 | 8.1 | 5.9 | 6.9 | 103.3 |
| Average snowy days (≥ 0.1 in) | 5.1 | 4.9 | 2.8 | 1.1 | 0.0 | 0.0 | 0.0 | 0.0 | 0.0 | 0.3 | 2.3 | 5.0 | 21.5 |
| Source 1: NOAA | |||||||||||||
| Source 2: National Weather Service | |||||||||||||
Population and Demographics
The population of Pocahontas has changed over the years. Here's a look at how many people have lived there during different census years:
| Historical population | |||
|---|---|---|---|
| Census | Pop. | %± | |
| 1880 | 37 | — | |
| 1900 | 625 | — | |
| 1910 | 987 | 57.9% | |
| 1920 | 1,302 | 31.9% | |
| 1930 | 1,308 | 0.5% | |
| 1940 | 1,730 | 32.3% | |
| 1950 | 1,949 | 12.7% | |
| 1960 | 2,011 | 3.2% | |
| 1970 | 2,338 | 16.3% | |
| 1980 | 2,352 | 0.6% | |
| 1990 | 2,085 | −11.4% | |
| 2000 | 1,970 | −5.5% | |
| 2010 | 1,789 | −9.2% | |
| 2020 | 1,867 | 4.4% | |
| U.S. Decennial Census | |||
2020 Census Information
In 2020, the census counted 1,867 people living in Pocahontas. There were 846 households and 492 families. The city had about 945 people per square mile.
Most of the people living in Pocahontas were White (95.9%). Smaller groups included Black or African American (0.7%), Native American (0.2%), and Asian (0.3%). About 0.7% of the population identified as Hispanic or Latino.
About 22.8% of households had children under 18 living with them. Many households (45.9%) were married couples. The average age of people in the city was 46.9 years old. About 23.9% of residents were under 20 years old.
2010 Census Information
The census in 2010 recorded 1,789 people in Pocahontas. There were 852 households and 493 families. The population density was about 886 people per square mile.
Most residents (98.3%) were White. Other groups included African American (0.3%) and Native American (0.1%). About 1.3% of the population was Hispanic or Latino.
About 21.6% of households had children under 18. The average age was 51.1 years. About 19.2% of residents were under 18 years old.
City Infrastructure
Transportation in Pocahontas
A railroad line reached Pocahontas in 1900, which helped the city grow. For air travel, the Pocahontas Municipal Airport is located about one mile northeast of the city.
The airport has two runways. One is made of concrete and is 4,100 feet long. The other is a grass runway, about 1,998 feet long.
Education
Public schools in Pocahontas are managed by the Pocahontas Area Community School District.
Notable People from Pocahontas
Here are some well-known people who have connections to Pocahontas:
- Larry Biittner (1946–2022), a former Major League Baseball player.
- Peg Mullen (1917–2009), an activist and writer who spoke out against war.
- James V. Schall (1928–2019), a Jesuit priest and professor at Georgetown University, known for his many writings.
See also
 In Spanish: Pocahontas (Iowa) para niños
 | Toni Morrison |
 | Barack Obama |
 | Martin Luther King Jr. |
 | Ralph Bunche |

