Port Isabel, Texas facts for kids
Quick facts for kids
Port Isabel, Texas
|
|
|---|---|

|
|

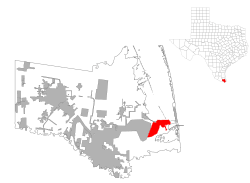
Location of Port Isabel, Texas
|
|
| Country | United States |
| State | Texas |
| County | Cameron |
| Area | |
| • Total | 13.80 sq mi (35.73 km2) |
| • Land | 6.79 sq mi (17.58 km2) |
| • Water | 7.01 sq mi (18.15 km2) |
| Elevation | 7 ft (2 m) |
| Population
(2020)
|
|
| • Total | 5,028 |
| • Density | 364.35/sq mi (140.72/km2) |
| Time zone | UTC-6 (Central (CST)) |
| • Summer (DST) | UTC-5 (CDT) |
| ZIP codes |
78578, 78597
|
| Area code(s) | 956 |
| FIPS code | 48-58892 |
| GNIS feature ID | 1375530 |
Port Isabel is a city in Cameron County, Texas, United States. It is part of a larger area that includes Brownsville and Harlingen. In 2020, about 5,028 people lived there.
The city's name is also used for the Port Isabel Detention Center. This center is about 12 miles northwest of the city. It is located near the Port Isabel-Cameron County Airport.
Contents
History of Port Isabel
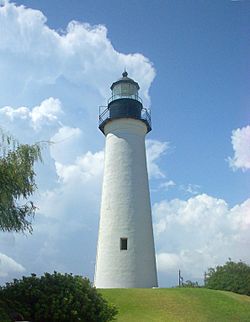
Port Isabel became a town after the Mexican War of Independence. This war helped Mexico gain freedom from Spain. The city quickly grew into an important port. It was known for exporting cotton before the American Civil War. During the Civil War, the harbor, town, and lighthouse were all fought over. Control of these places changed hands several times.
In September 1967, a strong storm called Hurricane Beulah hit the city. It caused a lot of damage. Later, on July 23, 2008, Hurricane Dolly also hit Port Isabel. This was a Category 2 storm that caused widespread damage.
Geography and Location
Port Isabel is located in the eastern part of Cameron County, Texas. It sits on the western side of the southern end of Laguna Madre. Laguna Madre is a type of estuary, which is where fresh water from rivers mixes with salty ocean water. It is connected to the Gulf of Mexico.
The Queen Isabella Causeway is a bridge that crosses Laguna Madre. It connects Port Isabel to South Padre Island. South Padre Island is a popular beach destination on the Gulf shore. The city of Brownsville, which is the county seat, is about 23 miles southwest of Port Isabel.
The United States Census Bureau says that Port Isabel covers about 13.6 square miles (35.4 square kilometers). About half of this area is land, and the other half is water.
Population and People
| Historical population | |||
|---|---|---|---|
| Census | Pop. | %± | |
| 1930 | 1,177 | — | |
| 1940 | 1,440 | 22.3% | |
| 1950 | 2,372 | 64.7% | |
| 1960 | 3,575 | 50.7% | |
| 1970 | 3,067 | −14.2% | |
| 1980 | 3,769 | 22.9% | |
| 1990 | 4,467 | 18.5% | |
| 2000 | 4,865 | 8.9% | |
| 2010 | 5,006 | 2.9% | |
| 2020 | 5,028 | 0.4% | |
| U.S. Decennial Census 1850–1900 1910 1920 1930 1940 1950 1960 1970 1980 1990 2000 2010 |
|||
2020 Census Information
The 2020 United States census counted 5,028 people living in Port Isabel. These people lived in 2,073 households. About 1,432 of these households were families.
The table below shows the different groups of people living in Port Isabel in 2020.
| Race | Number | Percentage |
|---|---|---|
| White (NH) | 907 | 18.04% |
| Black or African American (NH) | 10 | 0.2% |
| Native American or Alaska Native (NH) | 8 | 0.16% |
| Asian (NH) | 20 | 0.4% |
| Pacific Islander (NH) | 5 | 0.1% |
| Some Other Race (NH) | 13 | 0.26% |
| Mixed/Multi-Racial (NH) | 37 | 0.74% |
| Hispanic or Latino | 4,028 | 80.11% |
| Total | 5,028 |
Education in Port Isabel
Children who live in Port Isabel attend schools in the Point Isabel Independent School District. This school district has several schools within the city.
- Garriga Elementary School serves students from kindergarten to second grade.
- Derry Elementary School is for students in third to fifth grades.
- Port Isabel Junior High School teaches students from sixth to eighth grades.
- Port Isabel High School is for students in ninth to twelfth grades.
The mascot for both the junior high and high school teams is the Tarpon.
Students can also apply to schools in the South Texas Independent School District. This district offers special programs.
For higher education, Texas Southmost College is the designated community college. It serves all of Cameron County, including Port Isabel.
The Port Isabel Public Library provides books and resources for everyone in the city.
Climate and Weather
| Climate data for Port Isabel Cameron Co Airport, Texas (1981-2010) | |||||||||||||
|---|---|---|---|---|---|---|---|---|---|---|---|---|---|
| Month | Jan | Feb | Mar | Apr | May | Jun | Jul | Aug | Sep | Oct | Nov | Dec | Year |
| Mean daily maximum °F (°C) | 69.4 (20.8) |
71.8 (22.1) |
77.2 (25.1) |
82.4 (28.0) |
87.1 (30.6) |
91.1 (32.8) |
92.7 (33.7) |
92.9 (33.8) |
89.6 (32.0) |
84.8 (29.3) |
78.5 (25.8) |
70.5 (21.4) |
82.3 (28.0) |
| Mean daily minimum °F (°C) | 52.4 (11.3) |
55.0 (12.8) |
60.2 (15.7) |
67.0 (19.4) |
73.6 (23.1) |
77.3 (25.2) |
77.9 (25.5) |
77.2 (25.1) |
75.1 (23.9) |
68.5 (20.3) |
61.3 (16.3) |
53.5 (11.9) |
66.6 (19.2) |
| Average precipitation inches (mm) | 1.21 (31) |
1.44 (37) |
1.11 (28) |
1.41 (36) |
2.61 (66) |
2.45 (62) |
2.13 (54) |
2.06 (52) |
5.32 (135) |
2.91 (74) |
2.15 (55) |
1.30 (33) |
26.1 (663) |
| Source: NOAA | |||||||||||||
Port Isabel has a warm climate. The weather box above shows the average high and low temperatures. It also shows the average rainfall each month.
See also

- In Spanish: Port Isabel para niños

