
Road traffic safety facts for kids
Road traffic safety is all about keeping people safe on roads. It's about finding ways to stop road users from getting hurt or even killed. Road users include people walking, riding bikes, driving cars, and passengers on buses or trams.
A big goal in road safety is to make sure that if a crash happens, the force of the impact isn't strong enough to cause serious injury or death. For example, if a car hits someone walking, the chances of survival drop a lot if the car is going faster than 30 kilometers per hour (about 18 miles per hour). But for someone safely buckled into a car, they can often survive crashes at higher speeds.
Road safety has been studied for over 75 years to make our journeys safer.
Contents
History of Road Safety
In the past, roads were used by everyone – people walking, animals, and carts. Rules slowly developed to give certain types of traffic priority.
In ancient Rome, important people had servants clear the way for their chariots or litters so they wouldn't run over people.
When cars first appeared in the 1800s, they were noisy and scary! British laws made them go very slowly and even required a person to walk ahead with a red flag to warn others.
Over time, groups that supported cars pushed for motorized traffic to have priority. Safety laws then often pushed children playing off the streets. Ideas like shared space and living streets (called woonerven in some places) later came about to make roads safer and fairer for everyone again.
Keeping Pedestrians and Cyclists Safe
People walking and cycling are often the most vulnerable on roads. In some countries, they make up more than half of all road deaths. Here are some ways to make roads safer for them:
- Sidewalks: Wide enough paths for people to walk on, separate from cars.
- Pedestrian crossings: Special places for people to cross roads safely, usually close to where they want to go.
- Separate paths: Dedicated lanes or routes for cyclists and walkers, away from busy roads.
- Overbridges and underpasses: Bridges over roads or tunnels under them. These can be tricky because they might add extra distance or effort, and underpasses need good design to feel safe.
- Traffic calming: Things like speed bumps that make cars slow down.
- Low speed limits: Keeping car speeds low, especially in areas with many people walking or cycling. Speed cameras can help make sure people follow these limits.
- Shared space: Areas where all road users, including drivers, walkers, and cyclists, share the space equally and pay more attention to each other.
- Barriers: Fences or other barriers to stop people from crossing dangerous parts of the road.
- Cycling infrastructure: Special designs like protected intersections that make cycling safer.
In the mid-1900s, American road design focused on making roads safe for fast-moving cars. This often meant wide streets and clear areas next to roads, which made it harder for walkers and cyclists. More recently, "complete street" policies aim to design roads that naturally slow drivers down and make more space for people walking and cycling.
Some people who advocate for pedestrians question if safety plans are fair if they make walkers go out of their way, like using long overbridges or underpasses with steps. Successful plans for walkers often use crossings at street level, close to where people want to cross. For cyclists, successful plans try to avoid frequent stops, even if it means a slightly longer route, because stopping and starting takes more energy.
In Costa Rica, more than half of road deaths are pedestrians. A project there plans to build many kilometers of new footpaths and pedestrian crossings, which could save thousands of lives and prevent serious injuries over 20 years.

Animals on Roads
Collisions with animals are usually deadly for the animals and can sometimes be dangerous for drivers too.
Road Safety Campaigns

Information campaigns help tell people about ways to reduce road accidents. Some examples include:
- Think! (UK, 2000–present): Encourages people to wear seatbelts.
- Decade of Action (World Health Organization, 2011–2020): A global effort to improve road safety.
- Speeding. No one thinks big of you. (Australia, 2007): A campaign against speeding.
- Designated driver campaign (US, 1970s-present): Encourages someone sober to drive if others have been drinking.
- Click It or Ticket (US, 1993–present): Promotes seatbelt use.
- Green Cross Code (UK, 1970–present): Teaches children how to cross roads safely.
Road Safety Facts and Figures


How Roads Are Rated for Safety
Since 1999, an initiative called EuroRAP has been checking major roads in Europe. They give roads a "star rating" based on how well their design would protect car passengers in a crash. A 4-star road has the best safety features. This system has shown many road sections where people get hurt or killed because of missing safety features, like proper safety fences or clear road markings.
There are also plans to rate how likely a crash is on a road. These ratings help with planning and setting safety goals. For example, in Britain, two-thirds of all road deaths happen on rural roads, which are not as safe as motorways. Many accidents on rural roads happen when cars hit objects like trees. Improving driver training and adding safety features to rural roads are hoped to reduce these numbers.
In the United States, roads are not officially rated by the government for their safety features. However, studies show that many people are killed by objects on the road, like debris.
Deaths and Serious Injuries Statistics
The World Health Organization (WHO) estimated that in 2010, about 1.24 million people died worldwide and 50 million more were injured in car crashes. Young adults aged 15 to 44 years make up 59% of these deaths.
Here are some important facts from the WHO report:
- Road traffic injuries are the main cause of death for young people aged 15–29 years.
- About 91% of road deaths happen in low-income and middle-income countries, even though these countries have only about half of the world's vehicles.
- Half of those who die on roads are "vulnerable road users": people walking, cyclists, and motorcyclists.
- If nothing changes, road crashes are expected to kill about 1.9 million people each year by 2020.
- Only 28 countries (with 7% of the world's population) have good laws that cover all five main risk factors: speed, impaired driving, helmets, seatbelts, and child restraints.
It's thought that car crashes caused about 60 million deaths in the 20th century, which is similar to the number of deaths in World War II.
Because pedestrian safety hasn't improved as much as other areas, experts from the OECD and the International Transport Forum studied it and published a report called "Pedestrian Safety, Urban Space and Health" in 2012.
Data from Australia shows that changes in population, how many vehicles are registered, and how many kilometers are driven all affect the number of road deaths in different ways.
Road Safety in 2013
In 2013, the ITF looked at road safety in 37 countries. Here are some key numbers:
| Country | Deaths per 1 million people |
Deaths per 10 billion vehicle-km |
Deaths per 100,000 registered vehicles |
Registered vehicles per 1,000 people | Seatbelt wearing rates Front / Rear | Speed limit urban / rural / motorways (km/h) |
|---|---|---|---|---|---|---|
| 123 | n.a. | 23 | 529 | 52%,45% / 19%,45% | 30–60 / 110 / 130 | |
| 51 | 50 | 7 | 751 | 97% / 96% | 50, 60–80 / 100 or 110 / 110 | |
| 54 | 58 | 8 | 710 | 89% / 77% | 50 / 100 / 130 | |
| 65 | 71 | 10 | 627 | 86% / 63%,79% | 30–50 / 70–90 / 120 | |
| 55 | 56 | 9 | 644 | 95% / 95% (estimated) | 40–70 / 80–90 / 100–110 | |
| 34 | 39 | 6 | 523 | 94% / 81% | 50 / 80 / 130 (110) | |
| 48 | 48 | 7 | 725 | 95% / 87% | 50 / 80 (winter) 100 (summer) / 120 (100) | |
| 51 | 58 | 8 | 647 | 98% / 84%,90% | 50 / 90 / 130 (110 bad w.) | |
| 41 | 46 | 6 | 651 | 96–98% / 97,98% | 50 / 100 / no limit or 130 | |
| 40 | 69 | 6 | 657 | 96%,94% / 61% | 40,50,60 / 50,60 / 100 | |
| 34 | 45 | 5 | 537 | 97% / 82% | 50 / 80 / 130 | |
| 57 | 63 | 8 | 734 | 97% / 92%,93% | 50 / 100 / 100 | |
| 37 | 43 | 5 | 707 | 95% / 87–88% | 30,50 / 80 / 90,100,110 | |
| 27 | 34 | 5 | 597 | 97% / 81%,95% | 30,40,50 / 60,70,80,90,100 / 110 or 120 | |
| 33 | 43 | 5 | 708 | 94%,93% / 77%,93% | 50 / 80 / 120 | |
| 28 | 35 | 5 | 551 | 96% / 92% | 48 / 96 or 113 / 113 | |
| 103 | 68 | 12 | 852 | 87% / 74% | set by state / set by state / 88–129 (set by state) |
Road Safety in 2020
In 2020, the ITF/IRTAD gathered more recent figures from 34 countries:
| Country | Deaths per 1 million people 2018 |
Deaths per 10 billion vkm motorways 2018 |
Deaths per 10 billion vkm 2018 |
Deaths per 100,000 registered vehicles 2018 |
Registered vehicles per 1,000 people |
Seatbelt wearing rates Front |
Seatbelt wearing rates Rear |
Speed limit urban / rural / motorways (km/h) 2020 |
|---|---|---|---|---|---|---|---|---|
| 46 | 10 | 49 | 6 | 97/98 | 96 | 50 / 100 / 130 | ||
| 53 | 24 | 59 | 8 | 95 (2017) | 86 (2015) | 30-50 / 70-90 / 120 | ||
| 62 | 26 | 117 | 9 | 95 (2015) | 95 (2015) | 50 / 90 / 130 | ||
| 30 | 8 | 32 (or 31) | 5 | 97 (2018) | 93 (2019) | 50 (sections with 30, 40 or 60) / 70, 80 (90 for specific sections) / 110, 130 |
||
| 43 | 6 | 47 | 5 | 95 | 87 | 30-60 / 80, 100 / 100, 120 | ||
| 50 | 22 | 54 | 7 | 99 | 86 | 50 / 80 with 90 sections / 110 on dual carriageways 130 (110 wet + novice) |
||
| 40 | 17 | 44 | 6 | 99 | 98.5 | 50 / 100 / None < (130 recommended) |
||
| 39 | 10 | 40 (or 49) | 6 | >95 (2010) | 82 (2010) | 30-50 / 60-80 / 100-130 | ||
| 44 | 25 | 49 (or 42) | 6 | 95/96 (2018) | 78 (adults 2018) | 50 / 90 (110 on expressways) / 130 (110 on expressways) | ||
| 27 | 8 | 34 | 4 | 96/95 | 77 | 50 / 80 / 120 (100 on expressways) | ||
| 28 | 10 | 33 | 5 | 99 drivers, 97 passengers (2017 for GB) |
93 (2017 for GB) |
48 (30 mph) 96, 113 (60, 70 mph) 113 (70 mph) | ||
| 33 | 56 | 5 | 99 drivers, 96 passenger |
39 | 40, 50, 60 / 50, 60 / 100 | |||
| 112 | 70 | 12 | 90.9 drivers, 89.8 passengers | 76.1 (2018) | (see note) (see note) 88-129 |
(b) Real data (actual numbers instead of reported numbers by the police). (c) Mopeds are not included in the registered vehicles. VKM: vehicle-km In United-States, speed limits vary state by state.
Images for kids
-
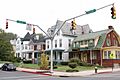
Sidewalks, curbs and traffic signals in Hagerstown, Maryland, United States
-
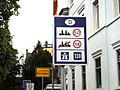
Speed limits in different areas, unusually with only a "recommended" limit (130 km/h) for the Autobahn
-
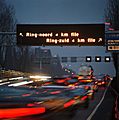
DRIP variable message sign guiding traffic on the Dutch A13 motorway
-

Vehicles experiencing a breakdown or an emergency can stop in the emergency lane; these lanes may themselves present risks to traffic.
-
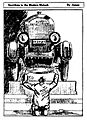
Sacrifices to the Modern Moloch, a 1922 cartoon published in The New York Times, criticizing the apparent acceptance by society of increasing automobile-related fatalities


See Also
 In Spanish: Seguridad vial para niños
- AAA Foundation for Traffic Safety (in the US)
- Defensive driving
- EuroRAP
- Geometric design of roads
- Highway Safety Manual
- List of countries by traffic-related death rate
- National Highway Traffic Safety Administration
- Road surface marking
- Speed limit
- Traffic collision
- Traffic sign
- Walkability
