
Black Diamond, Washington facts for kids
Quick facts for kids
Black Diamond, Washington
|
|
|---|---|
.jpg)
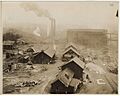
Top Works at Mine 11, Black Diamond, ca. 1915.
|
|

Location of Black Diamond, Washington
|
|
| Country | United States |
| State | Washington |
| County | King |
| Established | mid-1880s |
| Incorporated | February 19, 1959 |
| Government | |
| • Type | Mayor–council |
| Area | |
| • Total | 7.19 sq mi (18.65 km2) |
| • Land | 6.60 sq mi (17.09 km2) |
| • Water | 0.60 sq mi (1.54 km2) |
| Elevation | 653 ft (199 m) |
| Population
(2020)
|
|
| • Total | 4,697 |
| • Estimate
(2023)
|
6,602 |
| • Density | 1,000.51/sq mi (386.29/km2) |
| Time zone | UTC–8 (Pacific (PST)) |
| • Summer (DST) | UTC–7 (PDT) |
| ZIP Code |
98010
|
| Area code(s) | 360 and 564 |
| FIPS code | 53-06330 |
| GNIS feature ID | 1516603 |
Black Diamond is a city in King County, Washington, United States. In 2020, about 4,697 people lived there. By 2023, the population grew to 6,602. This made Black Diamond the fastest-growing small city in King County.
Contents
History of Black Diamond
How Black Diamond Started
Long ago, the Bəqəlšuł people lived in this area. Their name means "from a high point from which you can see." They were part of the Coast Salish people. They used to fish from Lake Sawyer and had a special place for cooking and smoking fish.
Black Diamond officially became a city on February 19, 1959. In recent years, many people have moved to Black Diamond. They often work in bigger cities like Seattle or Bellevue. This makes Black Diamond a "commuter community."
Coal Mining in Black Diamond
In the 1880s, Black Diamond was a busy place for coal mining. The Black Diamond Coal Mining Company from California started the mines. Many of the first workers came from another mine in California. They moved because the coal there wasn't as good. Also, new, better coal was found in Washington.
By the early 1900s, about 3,500 people lived in Black Diamond. Many were immigrants from Europe. Most of the men worked in the coal mines. The coal was sent to Seattle by train.
After World War I, the main mine closed because it wasn't making enough money. But in the 1930s, mining started again. The Morris brothers helped new mining operations grow. Coal mining continued for many years.
The main building of the Black Diamond Historical Museum used to be a train station. It served trains that carried passengers and coal. Trains stopped carrying passengers in 1925. But they still brought miners to work until 1931. They also hauled coal and other goods into the 1940s.
Planned Growth for the City
In the 1990s, Black Diamond started planning for its future. The city wanted to manage how it would grow. They created a plan called the Growth Management Act (GMA) Comprehensive Plan. This plan included an idea for "Master Planned Developments" (MPDs). These are large areas planned for many new homes and businesses.
In 2008, land was bought for the first MPD. The plans for these new developments were submitted in 2010.
Legal Challenges to Growth Plans
From 2010 to 2018, there were legal challenges that slowed down the building of these new areas.
- In 2010, a group called Toward Responsible Development filed a lawsuit against the first two MPDs.
- In 2012, a court sided with the city and the developers.
- In 2014, the group that filed the lawsuit was ordered to pay money for legal fees.
- In 2016, the developer sued some city council members who were against the plans.
- In 2017, the city council also sued the mayor.
- In 2018, the city and the developer settled their lawsuits.
First Master Planned Developments
The first two MPDs were designed to have 6,050 new homes. They also planned for 1.1 million square feet of shops and offices. These developments were expected to add about 15,000 new residents. This would make the city's population about 3.6 times bigger than it was in 2010.
Building on the first MPD, called Ten Trails, began in December 2013. The first families moved into Ten Trails in 2019.
In 2021, Black Diamond was the fastest-growing small city in King County. Its population grew by 21%.
By March 2022, 845 homes were occupied in Ten Trails. This included houses and apartments. At that time, about 2,053 people were estimated to be living in Ten Trails. This meant about 79% of Black Diamond's population lived in Ten Trails in March 2022.
Geography
Black Diamond covers an area of about 7.19 square miles (18.65 square kilometers). Most of this area is land.
There are also several lakes in or near the city. One of them is Horseshoe Lake.
Population Information
| Historical population | |||
|---|---|---|---|
| Census | Pop. | %± | |
| 1890 | 561 | — | |
| 1960 | 1,026 | — | |
| 1970 | 1,160 | 13.1% | |
| 1980 | 1,170 | 0.9% | |
| 1990 | 1,422 | 21.5% | |
| 2000 | 3,970 | 179.2% | |
| 2010 | 4,151 | 4.6% | |
| 2020 | 4,697 | 13.2% | |
| 2023 (est.) | 6,602 | 59.0% | |
| U.S. Decennial Census 2020 Census |
|||

In 2022, Black Diamond had about 2,072 households. On average, there were about 2.56 people in each home. The average income for a household was about $134,076 per year. About 0.9% of the city's population lived in poverty.
About 73% of people in Black Diamond had jobs. Most adults had a high school diploma (98.5%). More than half (52.5%) had a college degree or higher.
The most common backgrounds reported by people were English (90.9%), Spanish (3.8%), and Asian and Pacific Islander (3.4%). The average age in the city was 40 years old.
2020 Census Details
| Race / ethnicity (NH = non-Hispanic) | Pop. 2000 | Pop. 2010 | Pop. 2020 | % 2000 | % 2010 | % 2020 |
|---|---|---|---|---|---|---|
| White alone (NH) | 3,650 | 3,700 | 3,655 | 91.94% | 89.14% | 77.82% |
| Black or African American alone (NH) | 3 | 47 | 34 | 0.08% | 1.13% | 0.72% |
| Native American or Alaska Native alone (NH) | 57 | 29 | 26 | 1.44% | 0.70% | 0.55% |
| Asian alone (NH) | 40 | 50 | 129 | 1.01% | 1.20% | 2.75% |
| Pacific Islander alone (NH) | 1 | 12 | 15 | 0.03% | 0.29% | 0.32% |
| Other race alone (NH) | 10 | 4 | 27 | 0.25% | 0.10% | 0.57% |
| Mixed race or multiracial (NH) | 102 | 116 | 314 | 2.57% | 2.79% | 6.69% |
| Hispanic or Latino (any race) | 107 | 193 | 497 | 2.70% | 4.65% | 10.58% |
| Total | 3,970 | 4,151 | 4,697 | 100.00% | 100.00% | 100.00% |
According to the 2020 census, Black Diamond had 4,697 people. There were 1,729 households and 1,345 families. The city had about 717 people per square mile.
The racial makeup was mostly White (79.39%). Other groups included African American (0.75%), Native American (0.83%), Asian (2.83%), and Pacific Islander (0.36%). About 10.58% of the population was Hispanic or Latino.
About 24.4% of residents were under 18 years old. About 12.9% were 65 or older. The city had slightly more females (50.2%) than males (49.8%).
2010 Census Details
In the 2010 census, Black Diamond had 4,151 people. There were 1,546 households and 1,157 families. The population density was about 690 people per square mile.
The racial makeup was mostly White (91.95%). Other groups included African American (1.16%), Native American (0.75%), Asian (1.20%), and Pacific Islander (0.29%). About 4.65% of the population was Hispanic or Latino.
About 37.5% of households had children under 18. Most households (62%) were married couples. The average household size was 2.68 people.
The average age in the city was 40.4 years. About 25.2% of residents were under 18. About 10% were 65 or older.
City Landmarks
The City of Black Diamond has special places called landmarks. These are important historical sites.
| Landmark | Built | Listed | Address | Photo |
|---|---|---|---|---|
| Black Diamond Depot | 1886 | 2020 | 32627 Railroad Avenue | |
| Black Diamond Cemetery | c. 1880 | 2000 | Cemetery Hill Road | |
| Black Diamond Miners' Cabin | c. 1882 | 1995 | 24311 Morgan Street | |
| Luigi & Aurora Pagani House | c. 1896 | 2001 | 32901 Merino Street |


Notable People
Some famous people have connections to Black Diamond. Folk musician Brandi Carlile used to live here. Also, Edo Vanni, a minor-league baseball star, was born in Black Diamond in 1918.
Images for kids
-
Top Works at Mine 11, Black Diamond, ca. 1915.
See also
 In Spanish: Black Diamond (Washington) para niños
