Desert Shores, California facts for kids
Quick facts for kids
Desert Shores
|
|
|---|---|

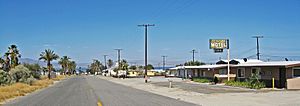
View east through Desert Shores to the Salton Sea.
|
|

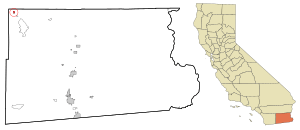
Location in Imperial County and the state of California
|
|
| Country | United States |
| State | California |
| County | Imperial |
| Area | |
| • Total | 0.81 sq mi (2.10 km2) |
| • Land | 0.70 sq mi (1.81 km2) |
| • Water | 0.11 sq mi (0.29 km2) 0% |
| Elevation | −200 ft (-60 m) |
| Population
(2020)
|
|
| • Total | 1,128 |
| • Density | 1,613.73/sq mi (623.44/km2) |
| Time zone | UTC-8 (Pacific) |
| • Summer (DST) | UTC-7 (PDT) |
| ZIP code |
92274
|
| Area codes | 442/760 |
| FIPS code | 06-19024 |
| GNIS feature IDs | 1693254, 2408665 |
Desert Shores (which used to be called Fish Springs) is a small community in Imperial County, California, in the United States. It's known as a census-designated place (CDP). This means it's an area that looks like a town but isn't officially a city. Desert Shores is part of the larger El Centro Metropolitan Area.
Contents
Geography and Climate

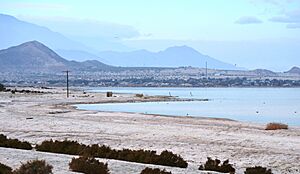
Desert Shores is located on the western edge of the Salton Sea. The Salton Sea is a large, shallow, salty lake in California. The community is also in the Imperial Valley, which is part of the Colorado Desert. This desert area is known for its very dry conditions.
The town is about 36 miles (58 km) west-northwest of Calipatria. The land area of Desert Shores is about 0.7 square miles (1.8 square kilometers). The ground here is mostly made of sand and clay from ancient rivers.
Desert Shores Weather
Desert Shores has a hot desert climate. This means it's very hot and dry most of the year. The coldest month is December. During this time, the average daytime temperature is about 71°F (22°C). Nights can drop to around 40°F (4°C).
July is the hottest month. The average daytime temperature can reach 108°F (42°C). Nights are still warm, around 76°F (25°C). The highest temperature ever recorded was 126°F (52°C). The lowest was 13°F (−11°C).
The area gets a lot of sunshine all year long. It only rains about 3 inches (76 millimeters) each year.
| Climate data for Desert Shores, California | |||||||||||||
|---|---|---|---|---|---|---|---|---|---|---|---|---|---|
| Month | Jan | Feb | Mar | Apr | May | Jun | Jul | Aug | Sep | Oct | Nov | Dec | Year |
| Record high °F (°C) | 93 (34) |
100 (38) |
107 (42) |
110 (43) |
119 (48) |
126 (52) |
125 (52) |
123 (51) |
126 (52) |
117 (47) |
100 (38) |
95 (35) |
126 (52) |
| Mean daily maximum °F (°C) | 71.8 (22.1) |
75.4 (24.1) |
81.7 (27.6) |
88.2 (31.2) |
96.2 (35.7) |
103.6 (39.8) |
107.7 (42.1) |
106.8 (41.6) |
102.2 (39.0) |
91.9 (33.3) |
79.3 (26.3) |
70.6 (21.4) |
89.6 (32.0) |
| Mean daily minimum °F (°C) | 40.8 (4.9) |
44.2 (6.8) |
50.3 (10.2) |
56.1 (13.4) |
63.8 (17.7) |
69.9 (21.1) |
76.3 (24.6) |
76.3 (24.6) |
69.7 (20.9) |
58.8 (14.9) |
46.7 (8.2) |
39.5 (4.2) |
57.7 (14.3) |
| Record low °F (°C) | 13 (−11) |
19 (−7) |
23 (−5) |
30 (−1) |
32 (0) |
48 (9) |
53 (12) |
51 (11) |
45 (7) |
28 (−2) |
24 (−4) |
18 (−8) |
13 (−11) |
| Average precipitation inches (mm) | 0.62 (16) |
0.61 (15) |
0.31 (7.9) |
0.05 (1.3) |
0.05 (1.3) |
0 (0) |
0.10 (2.5) |
0.11 (2.8) |
0.18 (4.6) |
0.19 (4.8) |
0.17 (4.3) |
0.40 (10) |
2.79 (71) |
People Living Here (Demographics)
| Historical population | |||
|---|---|---|---|
| Census | Pop. | %± | |
| 2000 | 792 | — | |
| 2010 | 1,104 | 39.4% | |
| 2020 | 1,128 | 2.2% | |
| U.S. Decennial Census | |||
The word "demographics" means facts about the people who live in a place. This includes how many people there are and what groups they belong to.
Population Changes
In 2020, about 1,128 people lived in Desert Shores. This number has grown over the years. In 2010, there were 1,104 people. In 2000, the population was 792. This shows the community has been slowly getting bigger.
Who Lives in Desert Shores?
In 2010, the U.S. Census counted 1,104 people in Desert Shores. Most people were White (64.2%). A smaller number were Native American (2.4%), African American (0.7%), or Asian (0.4%). Many people (76.8%) identified as Hispanic or Latino.
All the people counted lived in homes, not in special group housing.
Homes and Families
There were 344 homes in Desert Shores in 2010. In many homes (48.5%), there were children under 18. Most homes (52.6%) had married couples. Some homes had a single parent. The average home had about 3 people living in it.
There were 245 families. The average family had almost 4 people.
Age and Gender
The population of Desert Shores includes people of all ages. About 31.9% of the people were under 18 years old. About 13.3% were 65 years or older. The average age was about 30 years old.
For every 100 females, there were about 109 males in Desert Shores.
Income and Living
In 2000, the average income for a household was about $24,712 per year. For families, it was about $29,550. Some people in Desert Shores earned less than the average income. About 12% of families and 7.9% of all people lived below the poverty line. This means their income was below a certain level.
See also
 In Spanish: Desert Shores para niños
 | James B. Knighten |
 | Azellia White |
 | Willa Brown |


