Fillmore, California facts for kids
Quick facts for kids
Fillmore, California
|
|||
|---|---|---|---|
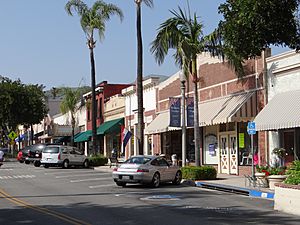
Central Avenue in downtown Fillmore
|
|||
|
|||
| Motto(s):
The Last, Best Small Town
|
|||
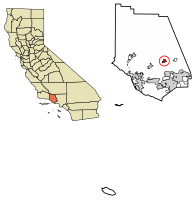
Location of Fillmore in Ventura County, California.
|
|||
| Country | United States | ||
| State | California | ||
| County | Ventura | ||
| Incorporated | July 10, 1914 | ||
| Government | |||
| • Type | Council-Manager | ||
| Area | |||
| • Total | 3.30 sq mi (8.55 km2) | ||
| • Land | 3.30 sq mi (8.55 km2) | ||
| • Water | 0.00 sq mi (0.00 km2) 0.03% | ||
| Elevation | 456 ft (139 m) | ||
| Population
(2020)
|
|||
| • Total | 16,419 | ||
| • Density | 4,805.3/sq mi (1,855.32/km2) | ||
| Time zone | UTC-8 (Pacific) | ||
| • Summer (DST) | UTC-7 (PDT) | ||
| ZIP codes |
93015-93016
|
||
| Area code | 805 | ||
| FIPS code | 06-24092 | ||
| GNIS feature IDs | 1652710, 2410504 | ||
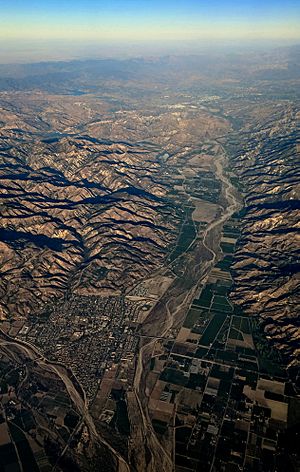
Fillmore is a small city in Ventura County, California, United States. It is located in the Santa Clara River Valley. This area has rich, fertile soil, which is great for farming.
Fillmore has a historic downtown area. It was created when the Southern Pacific railroad built tracks through the valley in 1887. The town was named after J. A. Fillmore, who was a general superintendent for the railroad company. In 2020, about 16,419 people lived in Fillmore. This was a 9.4% increase from 2010.
Contents
History of Fillmore
Early Days and Founding
In 1769, the Spanish Portola expedition explored inland California. They camped near what is now Fillmore on August 11. A missionary named Fray Juan Crespi was with them. He named the valley Cañada de Santa Clara. He wrote that they camped near a large Native American village.
Fillmore was officially founded in 1887 when the Southern Pacific Rail line arrived. The city decided to become an incorporated city in 1914. Local business owners and the newspaper, the Fillmore Herald, worked hard to make this happen.
Language and Natural Disasters
In 1985, the city council voted to make English the official language. However, this decision was changed in 1999.
On January 17, 1994, a strong earthquake hit the area. This was the Northridge earthquake. Fillmore was the most affected community in Ventura County. Luckily, no one in Fillmore died or was hurt. But over 200 buildings were damaged. About one-fifth of the historic downtown area was destroyed. This downtown had been used in many Hollywood films and TV shows. The earthquake caused about $50 million in damage. In the end, 60 buildings had to be torn down. Fillmore worked hard to rebuild most of its downtown.
Geography of Fillmore
Location and Natural Surroundings
Fillmore is located at the base of the Topatopa Mountains. It sits in the Santa Clara River Valley, below San Cayetano peak. This peak is part of the Los Padres National Forest. To the north, in the Topatopa range, is the Sespe Condor Sanctuary. This is a special place where the endangered California condor is being protected and is recovering.
The town is well-known for its many orange groves. Most homes in Fillmore are cottages, bungalows, and older houses. More than half of all homes were built after 1970. The oldest buildings are in the downtown area, especially around Central Avenue. Newer neighborhoods are mostly in the western part of the city. Most businesses are found on Ventura Street, which is also Highway 126.
The nearby Sespe Creek flows into the Santa Clara River. Fillmore is in an area of Ventura County known for farming and tree-growing. The city covers about 3.4 square miles (8.55 square kilometers). Almost all of this area is land.
Climate in Fillmore
Fillmore has hot and dry summers. Temperatures can easily go above 100 degrees Fahrenheit (38 degrees Celsius). This type of weather is called a warm-summer Mediterranean climate.
| Climate data for Fillmore, California | |||||||||||||
|---|---|---|---|---|---|---|---|---|---|---|---|---|---|
| Month | Jan | Feb | Mar | Apr | May | Jun | Jul | Aug | Sep | Oct | Nov | Dec | Year |
| Record high °F (°C) | 92 (33) |
92 (33) |
96 (36) |
105 (41) |
102 (39) |
106 (41) |
105 (41) |
105 (41) |
109 (43) |
108 (42) |
99 (37) |
99 (37) |
109 (43) |
| Mean daily maximum °F (°C) | 69 (21) |
69 (21) |
71 (22) |
74 (23) |
75 (24) |
77 (25) |
81 (27) |
83 (28) |
82 (28) |
79 (26) |
74 (23) |
69 (21) |
75 (24) |
| Mean daily minimum °F (°C) | 41 (5) |
43 (6) |
44 (7) |
46 (8) |
50 (10) |
53 (12) |
57 (14) |
56 (13) |
55 (13) |
50 (10) |
44 (7) |
41 (5) |
48 (9) |
| Record low °F (°C) | 25 (−4) |
26 (−3) |
25 (−4) |
30 (−1) |
35 (2) |
37 (3) |
38 (3) |
40 (4) |
40 (4) |
32 (0) |
28 (−2) |
25 (−4) |
25 (−4) |
| Average precipitation inches (mm) | 3.7 (94) |
5.0 (130) |
2.7 (69) |
0.8 (20) |
0.3 (7.6) |
0.1 (2.5) |
0.0 (0.0) |
0.0 (0.0) |
0.2 (5.1) |
0.7 (18) |
1.4 (36) |
2.5 (64) |
17.4 (446.2) |
| Source: The Weather Channel. | |||||||||||||
People and Population
| Historical population | |||
|---|---|---|---|
| Census | Pop. | %± | |
| 1920 | 1,597 | — | |
| 1930 | 2,893 | 81.2% | |
| 1940 | 3,252 | 12.4% | |
| 1950 | 3,884 | 19.4% | |
| 1960 | 4,808 | 23.8% | |
| 1970 | 6,285 | 30.7% | |
| 1980 | 9,602 | 52.8% | |
| 1990 | 11,992 | 24.9% | |
| 2000 | 13,643 | 13.8% | |
| 2010 | 15,002 | 10.0% | |
| 2020 | 16,419 | 9.4% | |
| U.S. Decennial Census | |||
Population in 2010
In 2010, Fillmore had a population of 15,002 people. Most residents lived in homes. About 57% of the people were White, and about 75% were Hispanic or Latino.
There were 4,156 households in Fillmore. Almost half of these households had children under 18 living in them. The average household had about 3.57 people. The average family size was 3.92 people.
About 30% of the population was under 18 years old. The average age in Fillmore was 31.9 years. For every 100 females, there were about 99.8 males. Most homes were owned by the people living in them (64.3%). The rest were rented.
Population in 2000
In 2000, there were 13,643 people living in Fillmore. About 53.5% of the people were White. About 66.6% of the population was Hispanic or Latino.
There were 3,762 households. About 45.8% of these households had children under 18. The average household size was 3.56 people.
About 32.3% of the population was under 18 years old. The average age was 30 years. The average income for a household was $45,510. About 13.2% of the population lived below the poverty line.
Economy and Tourism
What Drives Fillmore's Economy?
Fillmore's economy is still mostly based on agriculture. This means farming. A lot of the farming in the Fillmore area involves oranges, lemons, and avocados. These fruits are grown in orchards, then packed and shipped. More recently, growing special trees for landscaping has also become important.
Some row crop farming (like vegetables) and small factories are also in the area. The biggest employer in Fillmore is the Fillmore Unified School District. In 2014, there was a plan to build a business park on an old refinery property.
Things to See and Do (Tourism)
Fillmore has a charming downtown area with buildings from the early 1900s. You can visit the one-screen Fillmore Towne Theatre and unique shops.
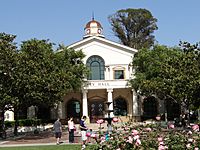
Next to the railroad tracks and city hall is the Railroad Visitor Center. It is run by the Santa Clara River Valley Railroad Historical Society. This center has many displays about trains. It also has a working train turntable and several old, restored railroad cars.
The Fillmore Historical Museum is another interesting place. It includes the old Southern Pacific Railroad Fillmore station, which was built in 1887. There's also a 1956 Southern Pacific railroad caboose and other train exhibits. A small post office from the community of Bardsdale and a 1919 farm worker bunkhouse from Rancho Sespe were moved to the museum site. The bunkhouse shows what life was like for farm workers. The 1905 Hinckley House, home of the town's first dentist, is also there.
For many years, the Fillmore and Western Railway took tourists on train rides through the orchards. This popular attraction stopped running in 2021.
Nearby, you can find the Fillmore fish hatchery. The Sespe Creek and Sespe Wilderness are also close by. This wilderness area is home to the California condor Sespe sanctuary.
Education in Fillmore
The Fillmore Unified School District serves the city. This district has two high schools, one middle school, and four elementary schools.
There is also a fifth elementary school in the town of Piru, which is part of the same school district. The Fillmore Christian Academy is a private school for students from kindergarten to 8th grade.
Elementary Schools
- San Cayetano Elementary School
- Rio Vista Elementary School
- Fillmore Christian Academy
- Mountain Vista Elementary School
Middle School
- Fillmore Middle School
High Schools
- Fillmore High School
- Sierra High School
City Infrastructure
Transportation in Fillmore
Major Roads
Fillmore is mainly served by two state highways:
Public Transit
VCTC
Fillmore is at the eastern end of the Ventura Intercity Service Transit Authority (VCTC) Highway 126 bus route. This bus route starts in Ventura and travels along Highway 126 through Saticoy and Santa Paula to Fillmore.
Valley Express
Fillmore now has its own regular bus service called Valley Express. There is one bus that travels in a 30-minute loop around the city. Another route connects Fillmore and Piru. Both of these city bus systems connect to the regional Highway 126 bus to Ventura. This allows for free transfers between the services.
Regular bus service for the Heritage Valley communities began in 2015. There are two routes in Santa Paula, one in Fillmore, and one in Piru that goes to Fillmore. These routes are planned to connect well with the VISTA Highway 126 route. Smaller 16-seat buses are used for the Valley Express. There are also "dial-a-ride" services in both cities, which you can call to arrange a ride.
Wastewater Treatment
The City of Fillmore Wastewater Treatment Plant is managed by Veolia North America. This plant cleans the city's wastewater.
Notable Residents
- Nati Cano (1933–2014), a famous mariachi musician and former leader of Mariachi los Camperos.
- Chad Hansen, an NFL Wide Receiver.
See also
 In Spanish: Fillmore (California) para niños
 | Lonnie Johnson |
 | Granville Woods |
 | Lewis Howard Latimer |
 | James West |


