Manila, Utah facts for kids
Quick facts for kids
Manila, Utah
|
|
|---|---|
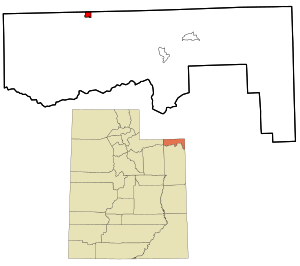
Location in Daggett County and the state of Utah
|
|
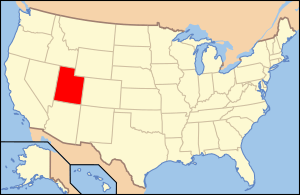
Location of Utah in the United States
|
|
| Country | |
| State | |
| County | Daggett |
| Founded | 1898 |
| Incorporated | 1936 |
| Named for | Manila |
| Area | |
| • Total | 1.03 sq mi (2.68 km2) |
| • Land | 1.03 sq mi (2.68 km2) |
| • Water | 0.00 sq mi (0.00 km2) |
| Elevation | 6,368 ft (1,941 m) |
| Population
(2020)
|
|
| • Total | 308 |
| • Density | 296.62/sq mi (114.50/km2) |
| Time zone | UTC−7 (Mountain (MST)) |
| • Summer (DST) | UTC−6 (MDT) |
| ZIP code |
84046
|
| Area code(s) | 435 |
| FIPS code | 49-47620 |
| GNIS feature ID | 2412942 |
Manila is a small town in Utah, United States. It is located in the northern part of Daggett County, very close to the Wyoming border. Manila is the main town, or county seat, of Daggett County.
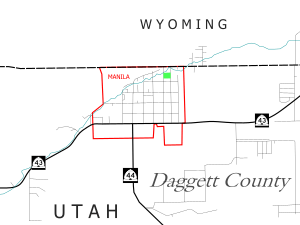
The town is found where two important roads meet: State Route 43 and State Route 44. In 2020, about 308 people lived in Manila.
Manila was founded in 1898. It was named to celebrate a big American naval victory. This victory happened during the Battle of Manila Bay in the Philippines.
There are many cool places to visit near Manila. To the east, you can find the Flaming Gorge National Recreation Area and the Flaming Gorge Reservoir. South of town is the Ashley National Forest. This forest is home to Kings Peak, which is the highest point in all of Utah!
Contents
Exploring Manila's Location and Weather
Manila is in the northeastern part of Utah. It sits north of the Uinta Mountains. The town is also west of the Flaming Gorge Reservoir, which is part of the Green River. The northern edge of Manila touches the border with Wyoming.
Manila's Streets and Roads
Manila has five streets that run from east to west. The main one is Utah State Route 43. The other four are named 1st through 4th Street, starting from the south. The main street running north to south is called Main Street. Other north-south streets are numbered, like 1st East Street and 1st West Street.
State Route 43 goes northeast for about 2.5 miles (4 km) to the Wyoming border. From there, Wyoming Highway 530 continues north to Green River. If you go west and then north from Manila on Route 43, it leads to Wyoming Highway 414 near Fort Bridger. Utah State Route 44 (Main Street) goes south and then east from Manila. It leads to U.S. Route 191 near Red Canyon.
The total area of Manila is about 1.03 square miles (2.68 square kilometers). All of this area is land.
-
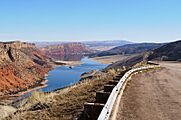
Flaming Gorge National Recreation Area south of Manila
Manila's Climate: Weather Patterns
Manila has a cold semi-arid climate. This means it is generally dry, but it can get quite cold.
| Climate data for Manila, Utah, 1991–2020 normals, extremes 1911–present | |||||||||||||
|---|---|---|---|---|---|---|---|---|---|---|---|---|---|
| Month | Jan | Feb | Mar | Apr | May | Jun | Jul | Aug | Sep | Oct | Nov | Dec | Year |
| Record high °F (°C) | 66 (19) |
67 (19) |
73 (23) |
84 (29) |
94 (34) |
98 (37) |
102 (39) |
97 (36) |
96 (36) |
98 (37) |
76 (24) |
65 (18) |
102 (39) |
| Mean maximum °F (°C) | 49.7 (9.8) |
54.7 (12.6) |
64.5 (18.1) |
73.1 (22.8) |
80.8 (27.1) |
87.8 (31.0) |
91.3 (32.9) |
89.3 (31.8) |
83.9 (28.8) |
74.7 (23.7) |
63.4 (17.4) |
52.9 (11.6) |
91.8 (33.2) |
| Mean daily maximum °F (°C) | 35.5 (1.9) |
38.8 (3.8) |
49.1 (9.5) |
55.5 (13.1) |
65.3 (18.5) |
75.9 (24.4) |
82.5 (28.1) |
80.7 (27.1) |
71.6 (22.0) |
59.7 (15.4) |
45.4 (7.4) |
34.1 (1.2) |
57.8 (14.4) |
| Daily mean °F (°C) | 23.8 (−4.6) |
26.8 (−2.9) |
36.3 (2.4) |
42.9 (6.1) |
52.0 (11.1) |
60.8 (16.0) |
68.2 (20.1) |
65.9 (18.8) |
57.3 (14.1) |
45.7 (7.6) |
33.3 (0.7) |
23.8 (−4.6) |
44.7 (7.1) |
| Mean daily minimum °F (°C) | 12.0 (−11.1) |
14.9 (−9.5) |
23.6 (−4.7) |
30.3 (−0.9) |
38.6 (3.7) |
45.7 (7.6) |
53.8 (12.1) |
51.1 (10.6) |
43.0 (6.1) |
31.6 (−0.2) |
21.2 (−6.0) |
13.6 (−10.2) |
31.6 (−0.2) |
| Mean minimum °F (°C) | −5.2 (−20.7) |
−4.7 (−20.4) |
8.4 (−13.1) |
16.1 (−8.8) |
23.9 (−4.5) |
33.7 (0.9) |
45.3 (7.4) |
42.4 (5.8) |
30.9 (−0.6) |
16.1 (−8.8) |
5.0 (−15.0) |
−5.0 (−20.6) |
−12.0 (−24.4) |
| Record low °F (°C) | −33 (−36) |
−33 (−36) |
−20 (−29) |
−6 (−21) |
12 (−11) |
20 (−7) |
20 (−7) |
27 (−3) |
18 (−8) |
−10 (−23) |
−20 (−29) |
−28 (−33) |
−33 (−36) |
| Average precipitation inches (mm) | 0.51 (13) |
0.55 (14) |
0.55 (14) |
1.02 (26) |
1.56 (40) |
1.19 (30) |
1.08 (27) |
1.32 (34) |
1.04 (26) |
1.53 (39) |
0.53 (13) |
0.58 (15) |
11.46 (291) |
| Average snowfall inches (cm) | 4.2 (11) |
6.4 (16) |
10.2 (26) |
5.9 (15) |
1.7 (4.3) |
0.0 (0.0) |
0.0 (0.0) |
0.0 (0.0) |
0.4 (1.0) |
1.2 (3.0) |
2.5 (6.4) |
5.1 (13) |
37.6 (95.7) |
| Average extreme snow depth inches (cm) | 3.8 (9.7) |
4.1 (10) |
4.0 (10) |
1.6 (4.1) |
0.9 (2.3) |
0.1 (0.25) |
0.0 (0.0) |
0.0 (0.0) |
0.0 (0.0) |
1.9 (4.8) |
1.3 (3.3) |
4.8 (12) |
6.7 (17) |
| Average precipitation days (≥ 0.01 in) | 2.4 | 2.8 | 5.0 | 4.3 | 4.6 | 4.8 | 6.9 | 6.0 | 5.2 | 4.2 | 2.4 | 2.8 | 51.4 |
| Average snowy days (≥ 0.1 in) | 2.5 | 2.9 | 4.2 | 1.6 | 0.3 | 0.0 | 0.0 | 0.0 | 0.1 | 0.7 | 1.9 | 2.8 | 17.0 |
| Source 1: NOAA (precip days, snow/snow days 1981–2010) | |||||||||||||
| Source 2: National Weather Service | |||||||||||||
Who Lives in Manila? Population Facts
| Historical population | |||
|---|---|---|---|
| Census | Pop. | %± | |
| 1910 | 196 | — | |
| 1920 | 212 | 8.2% | |
| 1930 | 256 | 20.8% | |
| 1950 | 147 | — | |
| 1960 | 329 | 123.8% | |
| 1970 | 226 | −31.3% | |
| 1980 | 272 | 20.4% | |
| 1990 | 207 | −23.9% | |
| 2000 | 308 | 48.8% | |
| 2010 | 310 | 0.6% | |
| 2020 | 308 | −0.6% | |
| U.S. Decennial Census | |||
In 2000, there were 308 people living in Manila. These people lived in 105 different homes. About 66 of these were families. The town had about 379 people for every square mile.
About 21% of the homes had children under 18 living there. More than half of the homes (51.4%) were married couples. About 34% of homes had just one person living there. Around 11% of homes had someone 65 years old or older living alone. On average, there were 2.20 people in each home. Families had about 2.83 people on average.
The population of Manila includes people of different ages. About 16% were under 18 years old. Around 29% were between 25 and 44 years old. About 27% were between 45 and 64 years old. And about 16% were 65 years or older. The average age in Manila was 40 years old.
See also
 In Spanish: Manila (Utah) para niños


