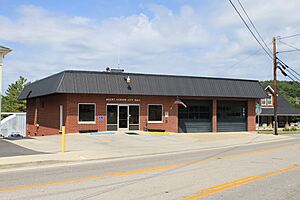
Mount Vernon, Kentucky facts for kids
Quick facts for kids
Mount Vernon, Kentucky
|
|
|---|---|
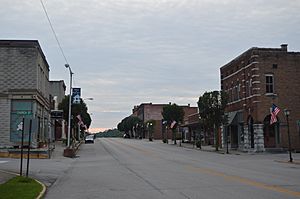
Downtown Mount Vernon (2011)
|
|
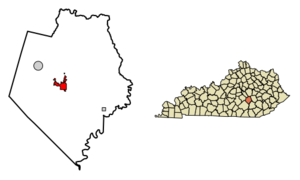
Location within Rockcastle County & Kentucky
|
|
| Country | United States |
| State | Kentucky |
| County | Rockcastle |
| Incorporated | 1818 |
| Reïncorporated | 1866 |
| Named for | George Washington's Virginia home |
| Area | |
| • Total | 2.83 sq mi (7.32 km2) |
| • Land | 2.81 sq mi (7.29 km2) |
| • Water | 0.01 sq mi (0.03 km2) |
| Elevation | 1,221 ft (372 m) |
| Population
(2020)
|
|
| • Total | 2,453 |
| • Estimate
(2022)
|
2,472 |
| • Density | 871.71/sq mi (336.52/km2) |
| Time zone | UTC-5 (Eastern (EST)) |
| • Summer (DST) | UTC-4 (EDT) |
| ZIP code |
40456
|
| Area code(s) | 606 |
| FIPS code | 21-54174 |
| GNIS feature ID | 2404325 |
Mount Vernon is a city in southeastern Kentucky, United States. It is known as a home rule-class city. This means it has the power to govern itself in many ways. Mount Vernon is also the main town, or county seat, of Rockcastle County.
The city is an important meeting point for two major roads: U.S. Route 25 and U.S. Route 150. In 2020, about 2,453 people lived in Mount Vernon. It is part of the Richmond-Berea micropolitan area, which is a group of smaller towns connected by their economies.
Contents
History of Mount Vernon
People from Europe first settled in this area around 1790. This was after the American Revolutionary War. The first settlement grew near a place called Spout Springs. Much of the land was originally wet and swampy.
The town was named after George Washington's famous home, Mount Vernon, in Virginia. In 1792, the Wilderness Road was built to reach this town. This road was a very important path for settlers moving west. When Rockcastle County was created in 1810, Mount Vernon was its main settlement.
Growth and Development
In 1883, a railroad line was built through Mount Vernon. This connected the town by train to bigger cities like Louisville and Knoxville. This made it easier for people and goods to travel.
The first newspaper in the county, the Mount Vernon Signal, started in 1887. Even though the area stayed mostly rural for a long time, things began to change. In the 1970s, the Interstate 75 highway was built nearby. This highway helped bring new businesses and jobs to the area. Since 1970, the population of Mount Vernon has grown by about 50%.
Geography and Location
Mount Vernon is located in the Cumberland Plateau region of Kentucky. It sits near Interstate 75 and the U.S. Routes 25 and 150. Interstate 75 runs just east of the city. You can get to Mount Vernon from exits 59 and 62 on I-75.
Travel Distances
- If you travel north on I-75, Lexington is about 55 miles (89 km) away.
- If you travel south on I-75, Knoxville, Tennessee, is about 119 miles (192 km) away.
- U.S. Route 25 and U.S. Route 150 meet in the center of Mount Vernon.
- U.S. Route 25 goes north about 17 miles (27 km) to Berea. It also goes southeast about 9 miles (14 km) to Livingston.
- U.S. Route 150 goes northwest about 25 miles (40 km) to Stanford.
Land and Water
The United States Census Bureau states that Mount Vernon covers a total area of about 3.7 square miles (9.6 square kilometers). Most of this area, about 3.2 square miles (8.3 square kilometers), is land. The rest, about 0.5 square miles (1.3 square kilometers), is water.
Population Information
| Historical population | |||
|---|---|---|---|
| Census | Pop. | %± | |
| 1830 | 142 | — | |
| 1840 | 209 | 47.2% | |
| 1860 | 156 | — | |
| 1870 | 252 | 61.5% | |
| 1880 | 90 | −64.3% | |
| 1900 | 422 | — | |
| 1910 | 930 | 120.4% | |
| 1920 | 719 | −22.7% | |
| 1930 | 939 | 30.6% | |
| 1940 | 1,100 | 17.1% | |
| 1950 | 1,106 | 0.5% | |
| 1960 | 1,177 | 6.4% | |
| 1970 | 1,639 | 39.3% | |
| 1980 | 2,334 | 42.4% | |
| 1990 | 2,654 | 13.7% | |
| 2000 | 2,592 | −2.3% | |
| 2010 | 2,477 | −4.4% | |
| 2020 | 2,453 | −1.0% | |
| 2022 (est.) | 2,472 | −0.2% | |
| U.S. Decennial Census | |||
According to the 2000 census, there were 2,592 people living in Mount Vernon. These people lived in 1,126 households. About 28.1% of these households had children under 18 years old.
The population was spread out by age. About 21.9% of the people were under 18. About 18.2% were 65 years old or older. The average age in the city was 38 years.
Education and Learning
Mount Vernon has a lending library for its residents. It is called the Rockcastle County Public Library. This library provides books and other resources for learning and reading.
Notable People
- Lori Stewart Gonzalez (born 1957), a speech pathologist and academic administrator. She is known for her work in education.
See also
 In Spanish: Mount Vernon (Kentucky) para niños
 | Isaac Myers |
 | D. Hamilton Jackson |
 | A. Philip Randolph |


